The Golden Cross Explained + Three Easy Strategies [Updated June 2026]
Jun 7, 2026
Written by: Al Hill
✓ Reviewed by Kunal Vakil, Co-Founder of TradingSim · Updated Jun 8, 2026
Key Takeaways
A golden cross occurs when a faster moving average (typically the 50-day) crosses above a slower one (the 200-day), signaling a potential shift to a bullish trend. (As of June 2026.)
It forms in three stages: a downtrend that bottoms, the faster MA crossing up through the slower MA, and the new uptrend continuing.
The opposite signal is the death cross, when the 50-day crosses below the 200-day — a potential bearish trend change.
The golden cross is a lagging signal built on moving averages, so it confirms trend rather than predicting it; combine it with support, volume, and price structure.
In this article, we’ll uncover one of the most important and popular setups using moving averages – the golden cross.
We’ll provide an explanation of the signal and then dive into three trading examples.
A golden cross occurs when a faster-moving average crosses a slower moving average. Sounds simple enough right? However, the key point is the moving averages which constitute the cross, and the direction in which they cross.
Specifically, you need the 50-period and 200-period simple moving averages. Anything other than these two periods and it is not a true golden cross.
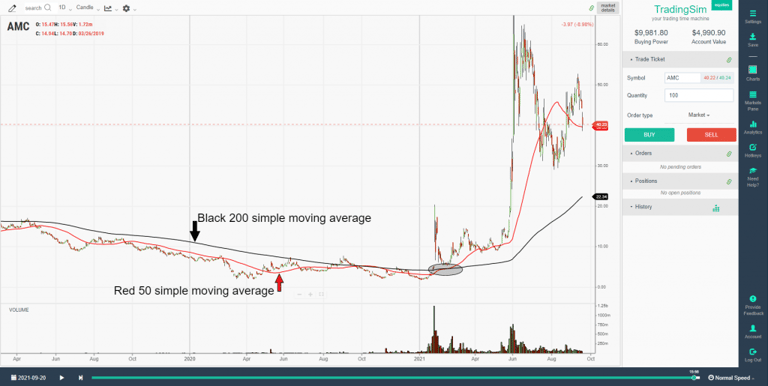
Directionally, a golden cross happens when a 50-day moving average for an asset trades higher than a 200-day moving average. In other words, prior to the the cross, the 50 moving average would have been below the 200sma. You can see this in the example below:
AMC 200 and 50 moving average cross
What this tells traders and investors is that momentum could be changing when the cross occurs. When the speed of the upward movement in a shorter time-frame is faster than the longer-term speed, that’s taken as a sign that investors might want to buy.
That is, with high trading volumes and higher trading prices, the golden cross is possibly a sign that the stock market, and individual stocks, are poised for recovery.
What are the three stages of a golden cross?
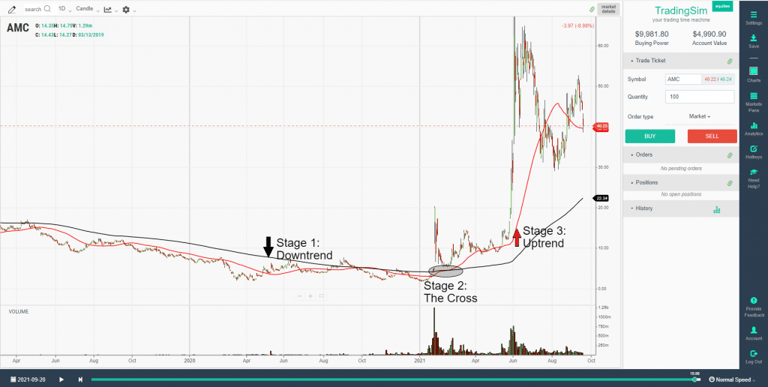
There are three stages of a golden cross.
As the downtrend in the stock market ends, the short-term 50-day moving average moves below the 200- day moving average.
In a crossover, when a stock recovers, the short-term moving average crosses over the long-term moving average. That’s where the term golden cross comes from, when the two average lines cross on a chart.
In the last stage, the short-term moving average continues to move upward. That’s usually a sign that the stock market is on a bullish trend.
The three stages of the golden cross
Is a golden cross a sign that investors should buy?
Golden crosses are not a guarantee of a bullish future in the stock market. Ari Wald is head of Technical Analysis at Oppenheimer & Co. He doesn’t see golden crosses as an absolutely bullish signal for the markets.
“All big rallies start with a golden cross, but not all golden crosses lead to a big rally,” he says.
Brian Shannon is the founder of AlphaTrends.net. He also agrees that golden crosses are not a definite timing signal to buy.
According to Shannon, “They tend not to be timing signals, but more for confirmation of a move that has been in place.”
In contrast, Jon Boorman sees golden crosses as good trading indicators. However, he also advises caution for investors as well.
“They’re perfectly valid, but people treat them all as individual trades rather than being part of a system. If you’re going to take one trade, take them all. You can’t pick one and then when it doesn’t work say ‘so much for that’. It’s an absurd thing for short-term traders and business TV to take notice of,” said Boorman.
“Just like any trend-following system, it will have plenty of whipsaw losing trades, but the winners will more than make up for those. It’s easy to pick holes in it, but very few have the discipline to execute it. Which is why it works,” added Boorman.
Is the golden cross an indicator of a bull market?
While financial analysts are skeptical about the golden cross being the start of a bull market, there is data to support the belief that it could be a good indicator. Schaeffer’s Senior Quantitative Analyst Rocky White found that there were gains in the stock market after a golden cross.
White found that the S&P 500 had healthier returns a few months after the first golden cross.
“The S&P has averaged healthier-than-usual returns looking one, three, six, and 12 months out, ” said Schaeffer’s Senior Quantitative Analyst Rocky White.
“For instance, the index has averaged a three-month gain of 4.07% after a golden cross, and was higher more than three-quarters of the time. That’s compared to an average anytime three-month return of 2.12% since 1950, with a positive rate of just 65.9%,” said White.
“On Thursday, the S&P 500’s 50-DMA crossed above the 200-DMA . Such is known as a “Golden Cross” and has now happened 25-times over the past 50-years. The long term performance of the S&P 500 following such an occurrence is unabashedly positive,” said Marcus.
“TPA calculated the performance of the S&P 500 10, 20, 40, 80, 160, and 320 days following each of the 25 Golden Crosses since 1970. The average performance is 0.88%, 0.98%, 3.25%, 6.73%, 9.57%, and 15.70%, respectively.
“The positive cross has happened 6-times in the past 10-years. The averages for 10, 20, 40, 80, 160, and 320 days following each was 0.53%, 0.89%, 2.64%, 8.17%, 10.45%, and 20.95%, respectively,” added Marcus.
Golden Cross Signal
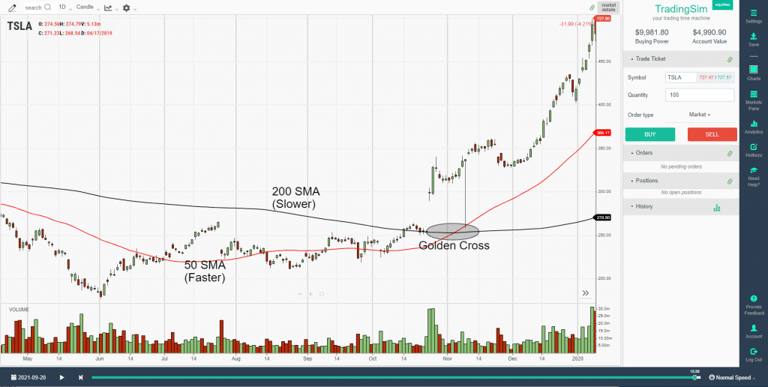
Golden Cross Example
The above chart of $TSLA displays a classic golden cross trading example. The blue line on the chart is a 50-period SMA and the red line is the 200-period SMA.
The chart begins with a strong downtrend, where the price action stays beneath both the 50-period and 200-period SMA.
Suddenly, the direction of the trend changes and price begins making a move to the upside. Naturally, the 50-period SMA reacts faster to the price change as it has a greater sensitivity to the most recent price action.
Once the 50-period SMA crosses the 200-period SMA to the upside, we have a golden cross. We have highlighted this in the grey circle.
Profit Potential of the Golden Cross Pattern
The profit potential will depend on the stock and the setup going into the trade. Sorry to be so vague, but that’s the reality of trading.
Death Cross
One option is to wait for a cross of the 50 back below the 200 as another selling opportunity. The only issue with this approach is you are likely to give back a sizeable portion of your profits since moving averages are a lagging indicator.
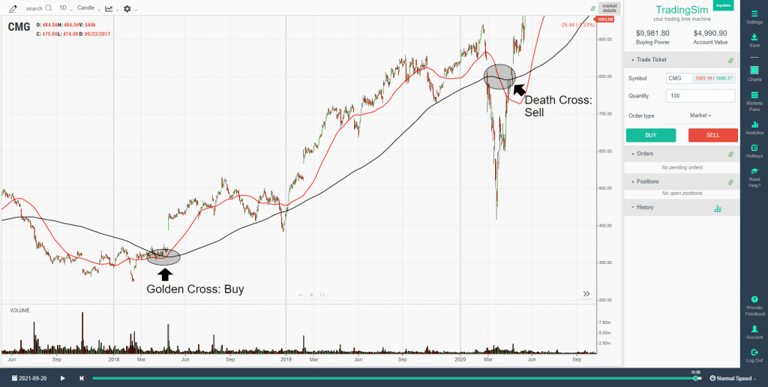
Here is an example of the “Death Cross” after riding a nice gain in Chipotle (CMG).
Golden and Death Cross Buy/Sell Signals
Notice that the sell signal comes as the market was already plunging. While you would have still had a nice gain, you must be ok with not “selling at the top.”
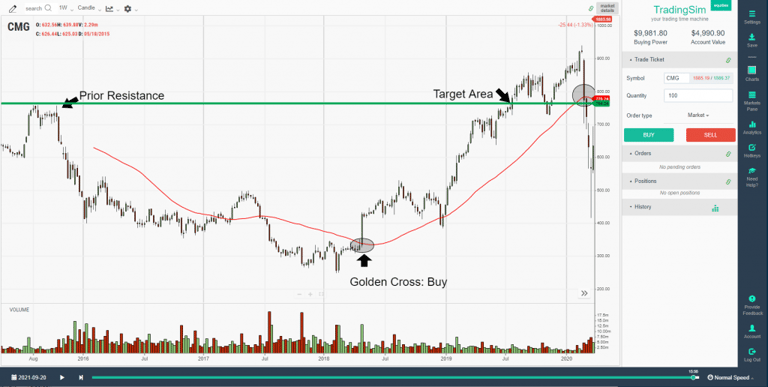
Prior Support
What you can also do is look for areas of resistance overhead which will act as selling opportunities for longs that have been holding the stock for a long period of time. Typically, bag holders from higher prices will be glad to get out at break-even.
Here is an example with CMG. We took the daily chart Golden Cross entry from above, then flipped to a weekly to see the target areas. Notice how close the exit would have been to the death cross still circled.
Selling at Resistance
A caveat to this strategy is that the stock may consolidate and push higher. You may want to hold part of your position and consider a potential breakout from the prior resistance area.
Trendline Break
If the golden cross is real, the signal will likely generate a strong buying opportunity. You can then use the first couple of reactionary lows to create an uptrend line. You then hold the stock until this trendline is broken.
Let’s look at an example of this below.
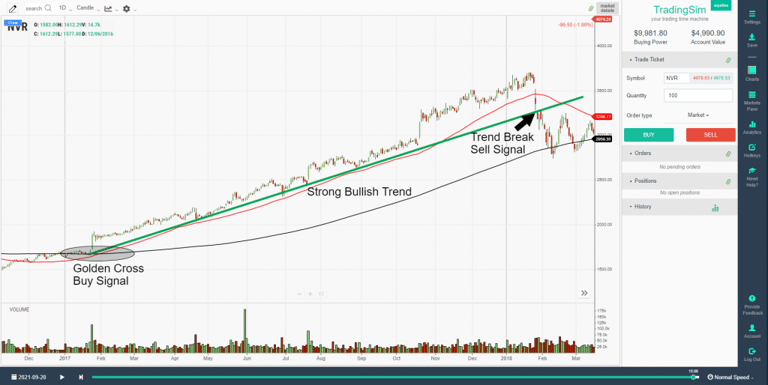
Bullish Golden Cross Pattern Example
Here we have a bullish golden cross stock pattern when the faster SMA on the chart breaks up and through the slower SMA in a bullish direction.
Trend Break Sell Signal
This is the same type of golden cross trading signal from the previous chart. However, this time we demonstrate the strength of the signal and the potential run a stock can make after a golden cross materializes.
If you don’t want to wait for the 50sma to break the 200sma on a death cross, you could have taken gains on the trend line break.
In this particular example for NVR, the stock went on a 100% run in 7 months.
Not a bad 7-month return for all you swing traders out there!
3 Strategies for Trading the Golden Cross
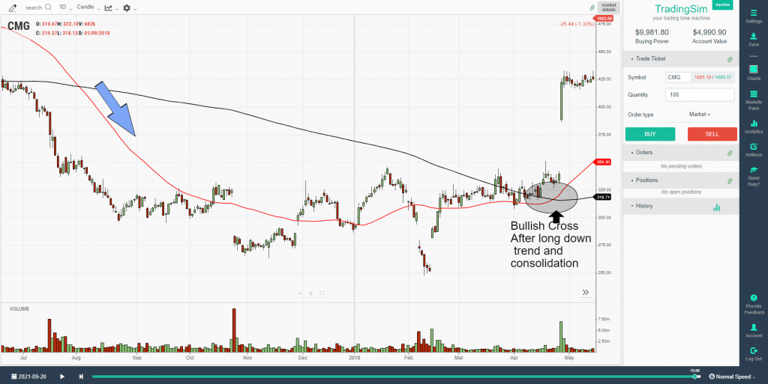
Strategy #1 – Look for Setups After a Long Down Trend
All golden cross setups are not equal. One method you can use is to wait for a stock that has had a long sustainable downtrend and then look for a stock that is ready to make a move higher.
There is so much bearishness in the stock that the signal has tremendous significance as a reversal.
Long down trend leads to bullish cross
The power of this signal is that the cross happens after a multi-month downtrend. By having such a long bearish trend, in order to get a bullish cross, there has to be a basing period. This basing period is the battle between the bulls and the bears.
Therefore, once the stock breaks to the upside, you know there is juice behind the move.
You can buy that initial breakout after the base, but realize you could still be in the thick of a bear market, so don’t get married to the stock. Look for opportunities as the stock rises to secure your gains.
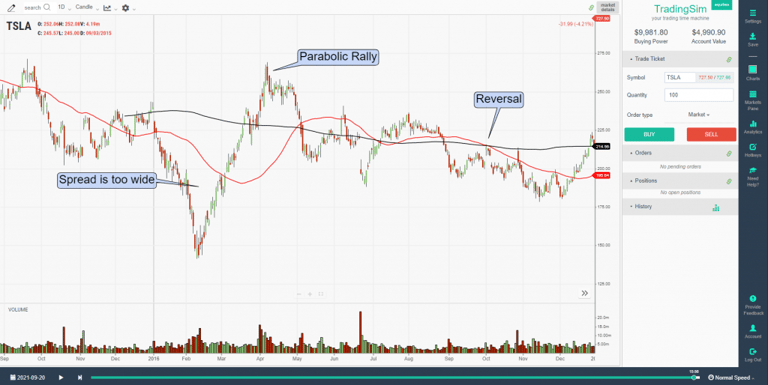
Strategy #2 – Avoid Wide Spreads Between Moving Averages
At times the averages will have a wide spread. This will present a cup-and-handle-like formation of the averages. On the surface, it’s going to look really bullish.
However, if you look at the price action, you will notice the pattern is unhealthy. First, the price is shooting straight up. What happens when a stock goes parabolic into a strong primary trend? It usually reverses.
Golden Cross to avoid
What does this chart example teach us?
You cannot ignore price action. Parabolic reversals should be treated with caution. This is especially true when you have a large overhead gap acting as resistance.
For these types of golden crosses, you may want to avoid them. While it might be considered a valid golden cross, there are better opportunities in the market with smoother, less volatile entry signals.
So, what’s the trade here? Well, there isn’t one.
As traders, we have to remember that sometimes the best action is no action at all.
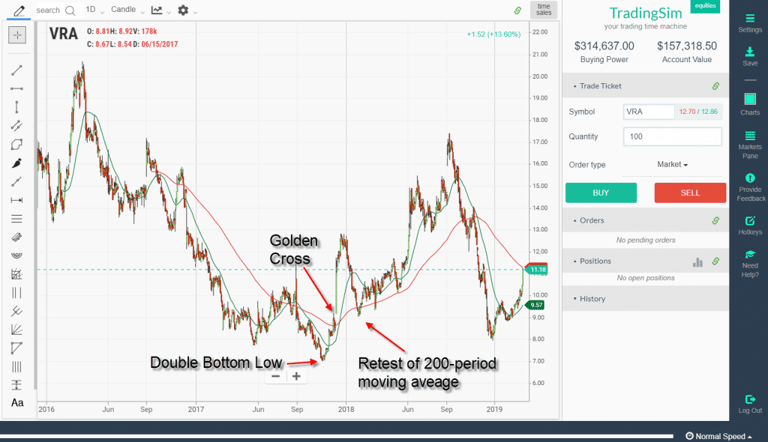
Strategy #3 – Combine Double Bottom Pattern with Golden Cross
The last strategy we will cover combines the double bottom chart formation with the golden cross.
Here is the setup.
Look for a double bottom on the chart. The second low should be lower than the first.
Next wait for the golden cross formation. Lastly, wait for the price to retest the 200 simple moving average.
You want to buy the test of the 200 moving average with a stop below the low of the double bottom.
The below chart illustrates this formation.
Golden Cross + Double Bottom
Conclusion
The golden cross is a powerful trade signal, but this does not mean you should buy every cross of the 50-period moving average and the 200.
You will need to bring a higher level of sophistication to the setup, to ensure you are buying into a trade with real opportunity.
How Can Tradingsim Help?
Tradingsim is the best market replay platform on the web. You can cycle through thousands of charts and replay the data to see which golden cross setup works best for your trading style.
Frequently Asked Questions
What is a golden cross in trading?
A golden cross is a chart pattern where a shorter-term moving average (usually the 50-day) crosses above a longer-term moving average (usually the 200-day), which many traders read as the start of a longer-term uptrend.
What moving averages make a golden cross?
The classic golden cross uses the 50-period and 200-period simple moving averages. Other periods can be used, but the 50/200 combination is the most widely watched.
Is a golden cross bullish or bearish?
A golden cross is considered bullish — it suggests upward momentum is building. Its bearish counterpart is the death cross, where the 50-day crosses below the 200-day.
Is the golden cross a reliable signal?
It can be useful for confirming a trend, but it is a lagging indicator that triggers after a move is underway and can produce false signals in choppy markets. Traders often combine it with support levels, volume, and other indicators.
What is the difference between a golden cross and a death cross?
A golden cross is the 50-day moving average crossing above the 200-day (bullish). A death cross is the 50-day crossing below the 200-day (bearish). They are mirror images of the same moving-average relationship.
Alton Hill is the Co-Founder of TradingSim with over 18 years of trading experience. He completed the Design Thinking Bootcamp at Stanford’s D.School and brings expertise in Product Development to create the best trading simulation experience. His strategy focuses on trend-following systems, targeting high-volatility stocks with strong primary trends using the 15-minute chart.
The 50-Day Moving Average: Guide, Setups & Golden Cross [Updated April 2026]
The 50-day moving average indicator is one of the most important and commonly used tools in stock trading. Considered an “intermediate-term” indicator, it is a multiple of the longer-term 100 and 200...
The Death Cross in Stock Trading Explained [Updated May 2026]
There are two longer-term moving average crossovers that are most famous or infamous among traders. Depending on the type of investor or trader, one is usually looked at as more favorable than the...
The death cross sounds so dramatic. The death cross is when a short-term moving average crosses to the downside through a long-term moving average. The most commonly used moving averages when...


 Overlay Indicators


