✓ Reviewed by Kunal Vakil, Co-Founder of TradingSim · Updated Mar 31, 2026
We have discussed many technical indicators on the Tradingsim blog. We have gone through many trading signals and strategies for increasing profit potential. However, nothing in trading is 100% and no one knows for sure the future of price action.
After all, if everyone could predict the trajectory of stock prices, we would all be millionaires and billionaires. The truth is that every technical indicator fails and we all need to know how to handle this reality.
Lagging Indicators
Lagging Indicators give you a confirmation signal. This is why they are called trend confirming, or trend following indicators. The signal from this indicator comes after the event occurred on the chart. In this manner, lagging Indicators “lag” the price action. The most popular lagging Indicators are the SMA and the MACD. These indicators give false signals for sure, but not that often. Let me show you:
Lagging Technical Indicators
Although the simple moving average is a lagging indicator it can also lure you in many losing trades in a row. The image above is the 2-minute chart of Oracle from May 5, 2016. The blue line on the graph is a 30-period simple moving average. This number of periods should reduce the noise; however, look what happens on the chart.
While the price tests our 30-period SMA as a support, it suddenly switches below the indicator. This gives a short signal on the chart. Six periods later, the price switches above the SMA, giving the opposite signal.
Then immediately we see Oracle slip back below and then above the SMA. We see one last false bearish signal before the price breaks the SMA upwards and enters a real trend.
In this example, we saw five false signals in a row caused by a 30-period SMA. Each of these false signals could lead to significant losses when trading on margin.
Now, let me show you a few false MACD signals:
Lagging Technical Indicators 2
Next we have the 2-minute chart of Ford. At the bottom of the chart you will see the MACD indicator, which gives three false signals.
The image starts with a price decrease. At the same time, the MACD indicator creates a bearish crossover. We interpret this as a bearish signal on the chart. However, the price enters a range and then begins to increase.
Later, the price creates two bearish crossovers after the price started increasing. Each of these two signals could be taken as a bearish indication on the chart. However, the price doesn’t start a bearish move and continues higher.
In this example, we have three bearish signals, which could lure us into three false trades in Ford. Each of these trades could bring a number of small losses to our account.
You will often see this type of trading activity during the midday trading session. If you get caught in these nonsense back and forth price action, you will surely bleed your account.
This is why it is so critical to either lower your profit targets for midday trading or work to identify the small number of volatile issues.
Leading Indicators
These are the indicators which give you the trend signal right in the beginning of the move. This is why they are called leading – because they lead the price action. Isn’t that great? You are able to hop in the trend right in its beginning and ride it all the way up!
However, the leading indicators give many false signals. Two of the most popular leading Indicators are the stochastic oscillator and the relative strength index. These two indicators have their own struggles with accuracy. Let me demonstrate to you:
Leading Technical Indicators
This is the 2-minute chart of Amazon from June 17, 2016. At the bottom of the chart, you see the relative strength index.
The chart begins with a price decrease. At the same time, the RSI is decreasing as well.
Suddenly, the RSI line enters the oversold area. The line then quickly breaks the oversold zone upwards. This gives a long signal on the chart. However, instead of increasing, the price has a small drop. Three periods after the oversold signal, the RSI line enters the oversold zone again. This creates another oversold signal on the chart. Then the indicator breaks the oversold zone upwards, which accounts for the price increase.
This is another strong bullish signal on the chart. Yet, the price stays flat. Meanwhile, the RSI indicator increases slowly. This supports the bullish outcome on the chart. However, the price then ends the range and drops rapidly. If traded, this RSI signal was definitely a loser.
Let’s now review a few false signals from the stochastic oscillator:
False Technical Signals
Above is the 2-minute chart of Oracle from May 9, 2016. At the bottom of the chart is the stochastic oscillator.
The chart starts with a decrease when the stochastic suddenly provides a strong oversold reading.
Furthermore, three times in a row the indicator breaks the oversold area upwards. These are all buying signals; however, the price stays flat. Shortly after the third signal, the price actually falls sharply lower.
This is completely counter to the signals we receive from the stochastic oscillator.
Later we receive strong overbought signals. As you can see, these signals did little to pull down the price of Oracle.
If you are unable to identify when to ignore price signals, you will constantly run into this challenge when trading the markets.
Again, I especially see the manipulation of stock prices during midday trading. This is when the volume is at its lowest, and smaller traders are able to move stocks higher and lower with ease.
Why Technical Indicators Fail
You should never forget that at their core, technical indicators gather past price data to determine oversold/overbought readings.
The technical data on the chart and the price action in general are formed by the clash of buyers and sellers of the respective stock. If there are more buyers, the price is likely to increase. If there are more sellers, the price is likely to decrease.
But who knows for sure who will win the battle? Nobody! We can only guess. In this manner, technical indicators always imply what might be the possible outcome. They technically cannot be 100% accurate.
In addition to all the factors we discussed above, we also need to briefly touch on the topic of high frequency trading. 20+ years ago, technical analysis worked somewhat reliably. Many retail traders would read up on their favorite chart pattern and a good portion of the time, things would play out as intended.
Stocks would easily hit their targets for formations such as head and shoulders pattern or ascending triangles.
Well, fast forward to today and we now have machines placing millions of buy and sell orders every minute. This in essence makes reading the tape and price action more difficult than ever.
Have you ever noticed how right when you place your order to sell short on a breakdown, the stock will inevitably reverse and go higher? Even though the formation on the chart was perfect?
This is the reality of the world within which we live now and until our government’s do something about it, it will be the norm for the foreseeable future.
Does Technical Analysis Really Work?
Have you ever experienced downswings in trading? You definitely have!
I would bet many times, you have been lured into losing trades by technical indicators, right? Then you change the indicators you use and your strategy, but it is still not working! Many people who appear to be in this situation simply quit trading and give up. I bet that many times you have asked yourself the question “Does technical analysis really work?” It is normal to have doubts when things are not going your way.
On the web, many so-called “experts” will say “technical analysis is nonsense!” without actually having a clue why. Some people think that if a chart pattern fails once, then it will always fail! Thus, the next time you ask yourself this question simply remember this: technical analysis does work!
However, you never know in which case your technical indicator will give you a valid signal. So, how exactly can a technical indicator for day trading bring you profits? The answer to this question is very simple. You can profit from technical analysis by adding to your strategy the basic concept of risk management.
Risk Management
You should always know the success rate of your trading strategy. At the same time, you can always control the amount you risk with a stop loss order. This means, you have full control over your trading strategy in the long term. You maybe don’t understand this. Let me explain further.
No matter what your strategy or what technical indicator you use, you and only you determine how much you are going to lose per trade.
In this manner, you have to know your edge and figure out what strategy you can use for managing your losses that will result in a positive net return.
Still not believing me?
I have been using the same trading approach with the Nikkei for the last 3 months. I would have some up days and some down days. But my consistency was lacking due to the different market conditions and rules on the Nikkei compared to the US market.
Well, one day I decided that enough was enough. I started to tighten my stops and quit for the day if I was up or down a certain amount. This discipline regarding how much I risk per trade and per day, has resulted in a win rate on the day of 80%.
Now this does not mean I am winning 80% of my trades, but just that I am able to walk away with cash in my pocket 4 out of 5 trading days.
So again, I ask you, does technical analysis still work?
Conclusion
Technical Indicators will fail and fail often.
Leading Indicators fail more than lagging indicators.
Technical indicators fail because nothing in trading is 100%.
Technical analysis and technical indicators do work once you take responsibility for your trading decisions. Remember, you do not have to take every trade.
However, to succeed with your trading strategy you need to learn how to properly manage the risk on each trade.
Alton Hill is the Co-Founder of TradingSim with over 18 years of trading experience. He completed the Design Thinking Bootcamp at Stanford’s D.School and brings expertise in Product Development to create the best trading simulation experience. His strategy focuses on trend-following systems, targeting high-volatility stocks with strong primary trends using the 15-minute chart.
Bear Trap – Best Strategies to Profit from Short Squeezes
Have you ever felt the devastating market force of a bear trap? The all but certain bullish trend stops abruptly and a trend reversal begins. Then you say, “Hey, let’s catch that drop!” and you...
Best Strategies for Trading with the Advance Decline Ratio
Advance Decline Ratio Definition The advance/decline ratio (A/D ratio) shows the ratio of advancing issues to declining issues. The A/D ratio is similar to the advance/decline line, except instead of...
Andrews Pitchfork Indicator – 4 Top Trading Strategies
The Andrews pitchfork indicator, commonly referred to as ‘median lines,’ is one of the most versatile trading tools available. We will explore the basics of the indicator and strategies you can use...


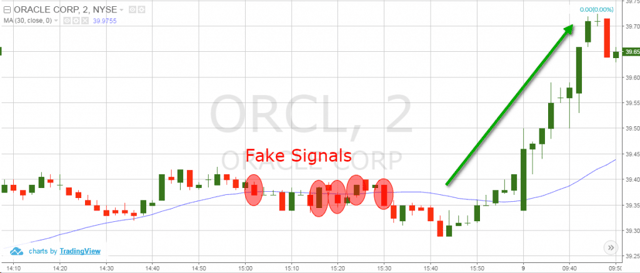
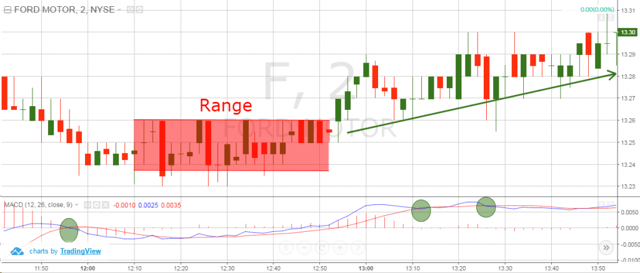
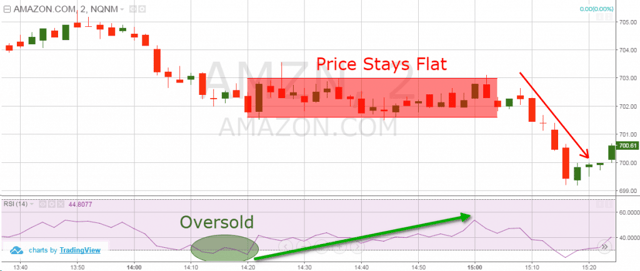
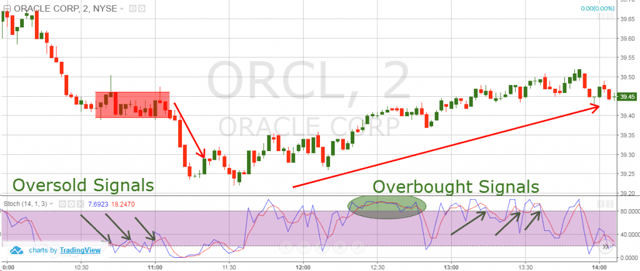


 Chart Patterns


