In this article, we will cover how to trade the dead cat bounce pattern, which is often a trap for traders looking to get long.
I will do a deep dive into how to trade the dead cat bounce pattern and the deadly consequences of timing your entry incorrectly.
What is a Dead Cat Bounce?
The dead cat bounce pattern is a chart phenomenon which occurs during bearish moves. Simply put, the dead cat bounce pattern is a long-awaited correction of a brutal bearish trend.
Imagine a stock is in a strong downtrend. Naturally, there are a large number of short sellers in the stock. However, some traders might decide that the stock has reached its lowest possible point.
These traders will look to close their short trades and some will even look to get long.
This of course leads to more buying pressure and the stock finds its footing. After this short bounce, the stock will once again proceed in the direction of the primary trend, leading to a swift sell off.
The below image depicts the dead cat bounce of Netflix.
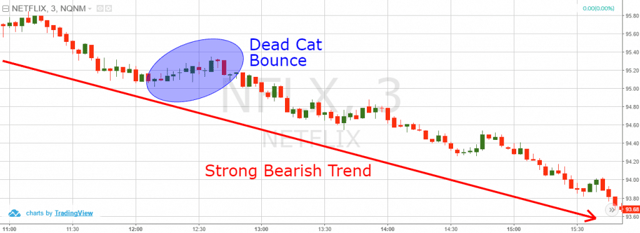
Dead Cat Bounce
Above you are looking at the 3-minute chart of Netflix from June 20, 2016. The image displays a strong bearish trend, which started in the $95.80 range.
In the blue ellipse, you see that the price increases shortly and then returns back to its bearish trajectory. The increase in the blue area is the dead cat bounce zone.
As you see, “the Cat dies” first; then it hits the bottom and bounces higher. If you take a closer look, you will see that there are few more dead cat bounces in the further price decrease.
How to Spot a Dead Cat Bounce
Spotting the dead cat bounce pattern is very tricky. Therefore, I will now share with you a solid approach for how to spot a dead cat bounce on the chart.
The confirmation of the pattern does not present itself on the price bounce; this is only the first signal there is a potential dead cat bounce.
The signal confirmation of a dead cat bounce pattern occurs when the price breaks the low of the previous bottom. Let’s explain this on a “fisher price” level:
- Identify a stock in a strong bearish trend.
- Spot a price increase, which breaks the slope of the downtrend. This bounce is minor in terms of retracing the down move from the most recent high.
- Wait for the price to break the low set before step 2.
The below chart illustrates the three points above:
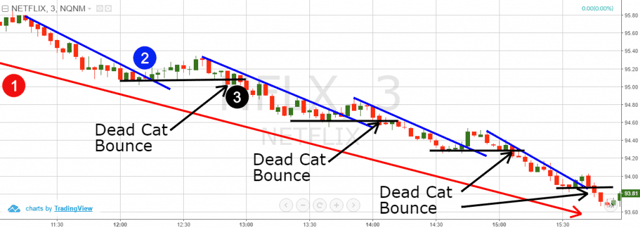
Dead Cat Bounce – Down Trend Lines
This is the same 3-minute chart of Netflix from the previous example. The blue lines on the chart represent the bearish downtrend that was eventually broken by the dead cat bounce.
Each black horizontal line represents the bottom on the chart prior to the dead cat bounce.
- First we identify the existence of a strong bearish trend. This can be determined with the first bearish impulse on the chart, which leads to 1% drop in the value of Netflix.
- Then we see that the price breaks in a bullish fashion.
- The price reverses and breaks its last bottom.
If you manage to identify these three events on your chart, then you are most likely looking at a dead cat bounce pattern.
How to Trade the Dead Cat Bounce
Now we need to discuss the steps for opening a dead cat bounce trade. It is crucial to mention that timing is very important when you trade this pattern. If you don’t stick to the trading rules of the dead cat bounce chart pattern, you might end up losing your shirt.
Opening a Dead Cat Bounce Trade
After you identify the dead cat bounce pattern, you should short the stock when the price action breaks the last bottom created.
The timing of your trade entry is crucial. If you don’t open your trade on time, you might miss a significant part of the price decrease. After all, the further decrease of the dead cat bounce formation is an impulsive move.
The dead cat pattern could prove “deadly” if you don’t use a stop loss order. What if you are wrong and this is not a dead cat bounce pattern? What if you are actually short selling a stock, which has put in a significant bottom and ready to make a strong move higher.
When these reversal moves occur, they are sharp and fast. This pain of course can intensify itself if you are trading on margin.
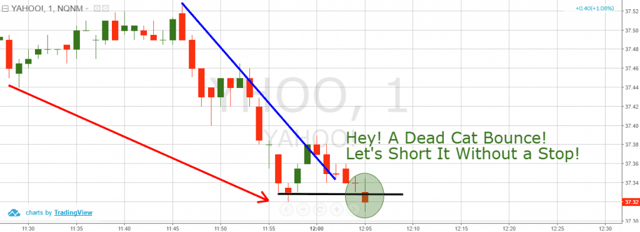
Trading a Dead Cat Bounce without a Stop Loss
In the image above, we see symptoms of a real-life dead cat bounce pattern:
- We identify a relatively strong bearish trend.
- The price breaks the last impulse upwards.
- The stock then closes a candle below the last bottom confirming the dead cat bounce pattern.
That is a sure deal right? So, why place a stop loss order?
Dead Cat Bounce – Trade Gone Wrong
When reviewing the above chart, you might say to yourself, “No big deal! It will definitely start dropping again!”
You think so?
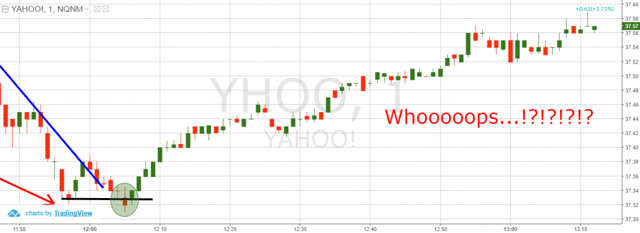
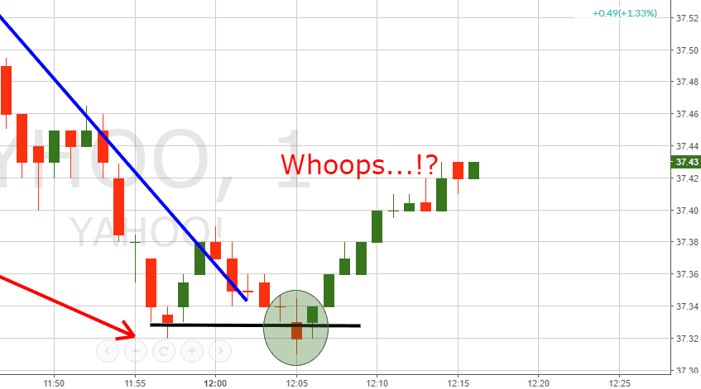
Dead Cat Bounce – No Way Out
Now what? A simple continuation trade will lead to enormous financial and emotional pain. This sharp counter move higher all took place in less than an hour!
For this reason, you will always want to place a protective stop loss order when trading the dead cat bounce pattern.
The correct location for your dead cat bounce stop loss is above the peak created during the bounce.
Since this might confuse you, I will show you where your stop loss should be in the previous trade demonstrations:
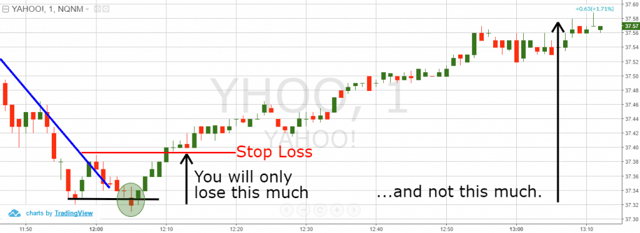
Dead Cat Bounce – Proper Stop Loss
As you can see, taking the quick loss is critical to staying in the game for the long-term.
Taking Profits – Dead Cat Bounce
When you discover a dead cat bounce pattern, you should aim for a minimum price move equal to the previous trend impulse. In other words, if the price starts dropping suddenly and you confirm a dead cat bounce pattern afterwards, then you should expect the price to drop at least with the same size. Have a look at the below example:
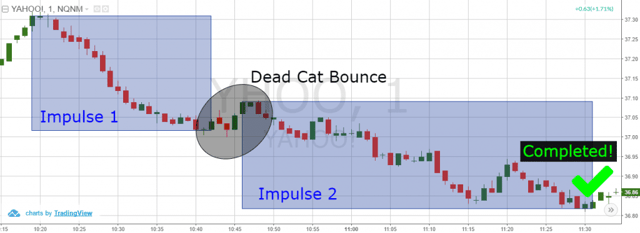
Dead Cat Bounce Targets
Yahoo starts with a strong bearish trend. We classify this first selloff as “Impulse 1” because it is simply the first impulse of a bearish trend. Suddenly, a dead cat bounce pattern appears on the chart.
The stock price attempts to pick up, but then it breaks the level of its last bottom, which leads to impulse 2.
Since the target for a dead cat bounce pattern is the size of the prior range, we simply add this to the low that is broken. As you can see in the above chart, we have highlighted where the pattern completed and you should book your profits.
Dead Cat Bounce Trading Example
Now that we discussed all the important rules regarding the dead cat bounce, I will now show you a real trading example with this chart pattern. We will apply the rules we discussed above in order to walk you through the trade.
Below are the steps for how to place the trade:
- Identify a relatively strong bearish trend
- Mark the bearish impulse with a bearish trend line
- Price breaks the trend line and increases
- Mark the level of the last bottom
- Price breaks the last bottom, confirming the pattern
- Short the stock
- Place a stop loss order above the top
- Stay in the market until the price creates a bearish move equal to the initial impulse
Let’s now see how these 8 trading rules look on a dead cat bounce chart:
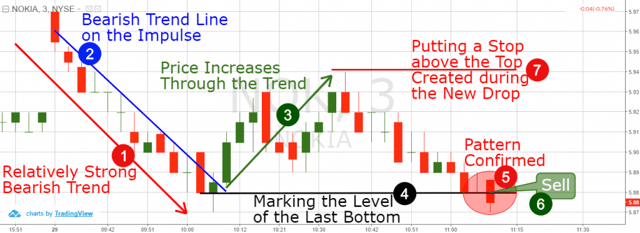
Dead Cat Bounce – Real-Life Example
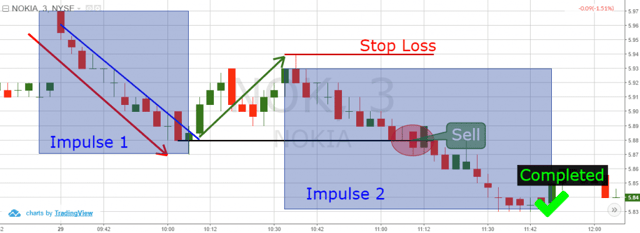
This is the 3-minute chart of Nokia from April 29, 2016. The image illustrates how to trade the dead cat bounce pattern.
- The image starts with a relatively strong bearish trend, which we have marked with the red arrow on the chart.
- Then we put the blue bearish trend line on the trend’s impulse.
- The price increases through the blue trend. We have marked the bullish price move with the green arrow on the image.
- Since the blue trend is broken, we need to indicate the level of the last price bottom. This is shown with the black horizontal line on the chart.
- In the red circle, Nokia’s price breaks the lowest point of the initial price impulse.
- This is where we sell Nokia.
- Then we place the stop loss order above the top created in the beginning of the new price decrease. We have marked the stop location with a red horizontal line.
Now, we need to see if the price is going to complete the last step (8) by reaching the minimum target of the pattern.
Dead Cat Bounce – Walking Through the Trade
Again, we mark the two bearish impulses with the blue rectangles on the chart.
After the price confirms the dead cat bounce pattern, the stock continues to trend in a bearish direction. When we apply the size of the first impulse over the second impulse which we are trading, we are able to identify a minimum target.
As you see, the price completes the minimum target less than 25 minutes after the pattern is confirmed. At the same time, our trade is constantly protected by our stop loss order.
It is important to emphasize that timing is crucial when trading a dead cat bounce pattern. If we don’t enter the market in the right moment, there is a big chance that we miss a significant part of the further bearish move. Therefore, make sure you short the stock exactly in the moment when you see a candle closing below the last low of the stock.
Conclusion
- The dead cat bounce is a pattern, which occurs during bearish price moves.
- The pattern represents a price pick up in the time of the bearish trend. However, after the increase the price drops further, breaking its lower bottom.
- The psychology behind the pattern is that the initial short sellers consider that the stock has hit a bottom. Therefore, some close their short trades. And others even buy the stock attempting to catch a reversal. This gives a better short entry for sellers, who open new short trades. This causes the stock to drop, sometimes even stronger.
- To identify a dead cat bounce pattern, you need to implement the following steps:
- Identify a stock which is in a strong bearish trend.
- Spot a price increase, which breaks the tendency of the previous trend impulse.
- Wait the price to break the last bottom created.
- When you trade a dead cat bounce pattern you need to:
- Open a trade when the price breaks its previous low
- Put a stop loss above the created top
- Stay in the trade until the newly created impulse is equal to the initial impulse in terms of size.
- Step-by-step Guide for Trading dead cat bounce stocks:
- Identifying a relatively strong bearish trend
- Marking the bearish impulse with a bearish trend line
- Price breaks the trend line and increases
- Marking the level of the last bottom
- Price breaks the last bottom, confirming the pattern.
- Shorting the stock
- Placing a stop loss order above the top created in the time of the breakout
- Staying in the market until the price creates a bearish move equal to the initial impulse.
Look for a stock down at least 20-30% from a recent high that suddenly rallies on lighter volume than the decline. The bounce typically stalls at a prior support-turned-resistance level or a falling moving average like the 20-day EMA.
Most dead cat bounces retrace 20% to 50% of the prior decline. Bounces that exceed 60% of the prior leg often signal a real reversal rather than a dead cat bounce.
Bearish. By definition the rally fails and the larger downtrend resumes. Mistaking a dead cat bounce for a bottom is one of the most expensive mistakes in trading.
The cleanest approach is to wait for confirmation that the bounce has failed — a lower high on the daily chart, a break of the 9 or 20 EMA on the 5-minute chart, or a heavy volume red bar — then short with a stop above the recent high.
A real reversal is confirmed by higher highs and higher lows on the daily chart, expanding volume on the rally, and breakout above key resistance. A dead cat bounce shows none of those — just a brief countertrend pop on weak volume that quickly fades.
The fastest way to internalize any concept in this guide is to test it on real historical price data. TradingSim is the leading replay-based simulator for stock and futures traders — rewind any market day, drop in your setup, and see exactly how it would have played out. Practice futures trading with realistic margin and contract behavior, or run unlimited equity simulations against tick-level historical data.


 Awesome Day Trading Strategies


