When starting out in trading, there are a barrage of indicators thrown at you, all with promising strategies tied to them. The exponential moving average is sure to be one of them. Along with the simple moving average, the exponential moving average is one of the most popular indicators in all of trading.
But how to do you condense all the different indicators down to what works for you? In this guide to exponential moving averages, we'll explain why this indicator could be one of the only indicators you choose to use on your trading charts. You'll learn how to calculate it, how to set it up on your charts, which time frames are best, and how to trade the exponential moving average.

What is the exponential moving average in stocks?
The exponential moving average (EMA) is a line that is drawn on stock charts, which indicates the average price of the stock over a given period of time. You can adjust that time period as you wish. It allows for you to "smooth out" the price changes in order to see the overall trend in price.
On a stock chart, it can be represented by different color lines, of your choosing. You can even have multiple exponential moving averages on a single chart. In fact, you might even have exponential moving average clouds which show a highlighted range between one time period EMA and another.
Here is an example of a handful of exponential moving averages plotted on a chart inside our TradingSim application charts:
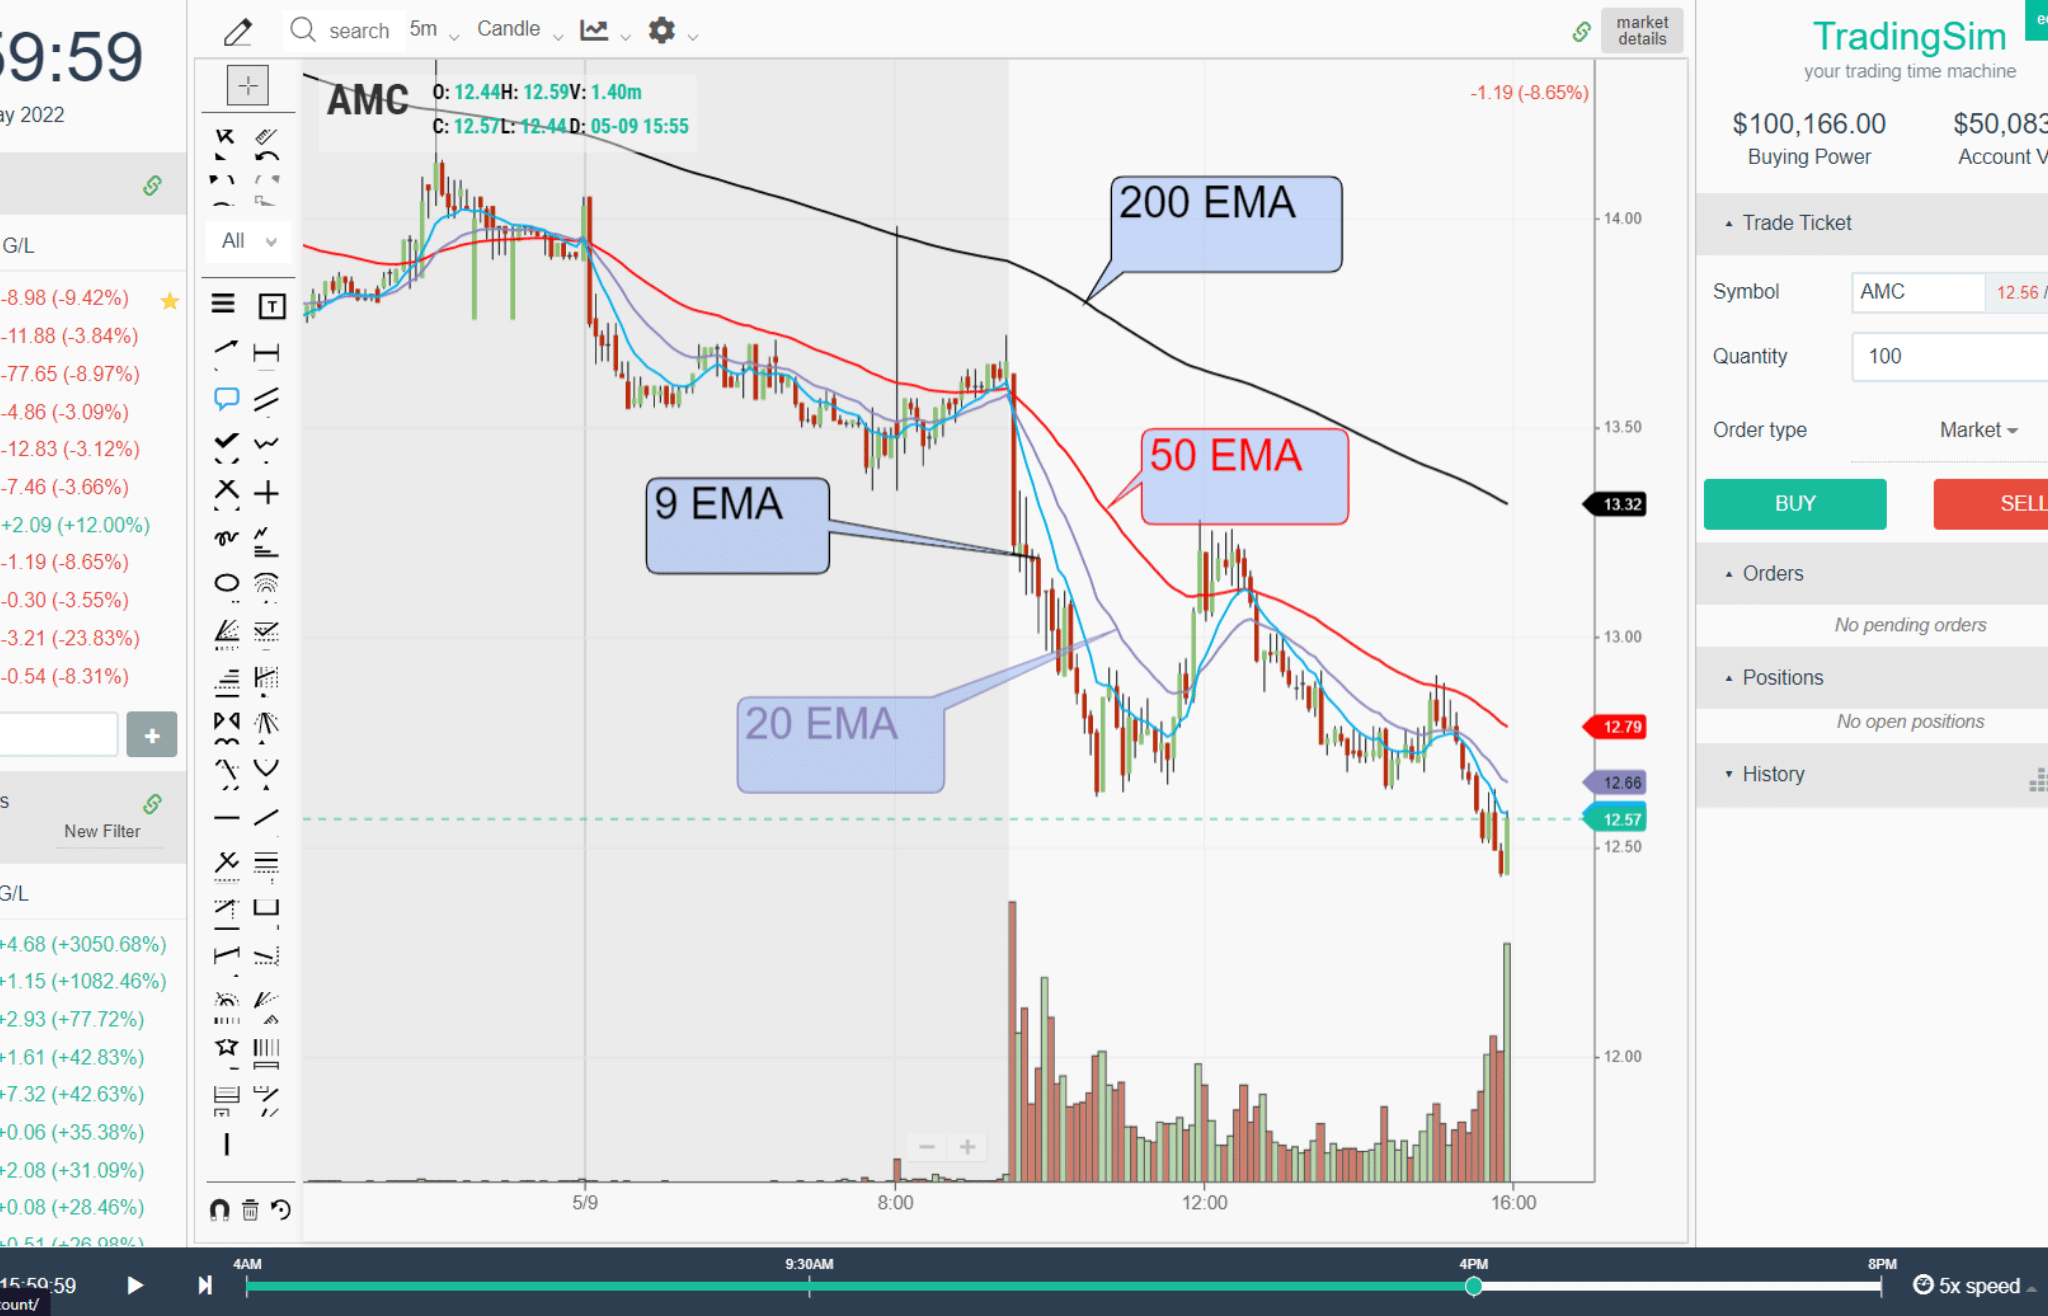
Notice the different colors, time periods, and the slope of each moving average.
How exponential moving average Formula is calculated?
To calculate the EMA, multiply the current value of the stock by a smoothing value (usually equal to 2) that is divided by the look-back period plus 1. This is then added to the previous EMA value multiplied by a formula that looks like this:
1 - (Smoothing Value / (1 + Look-back period))
The entire formula will go like this:
EMANow = (ValueNow * (Smoothing / 1 + Period))
+
EMAPrevious * (1 - (Smoothing Value / (1 + Period)))
Where :
Smoothing = 2
Period = number of candles in the look-back (i.e. 20, 50, 9, etc.)
If you increase the smoothing factor, it will give even more weight to the more recent price action.
Thankfully, charting platforms make these calculations for us, these days. But the point is to show that the exponential moving average is calculated in such a way as to smooth out much of the noise in price action, but also to add weight to the most recent values.
difference between the Simple Moving Average and the Exponential Moving Average
To calculate the simple moving average (SMA), you have a pretty simple formula to follow. Add up the closing price of the days/candles in the lookback period. For example, if you were to choose a 9 SMA, that would be 9 closing prices. Then, divide that number by 9 for the average.
The difference with the EMA is that you add a smoothing multiplier into the formula that adds weighting to more recent days in the lookback period.
So, for a 9 EMA, and using the typical value of "2" as our smoothing value, this would look something like:
(Smoothing / 1 + Period) = Multiplier
[2 ÷ (9 +1)] = 0.20
This becomes your multiplier. You then plug this into the formula given above. This will give you more weight to recent closing prices, whereas the simple moving average gives equal weight to all closing prices.
You can vary your results based on whether you choose the closing price or some other price within the prior candle you're observing in the formula, like open, high, low, or median. However, the general rule of thumb is to use the closing price.
Here is what a 9 EMA and a 9 SMA would look like on an intraday chart:
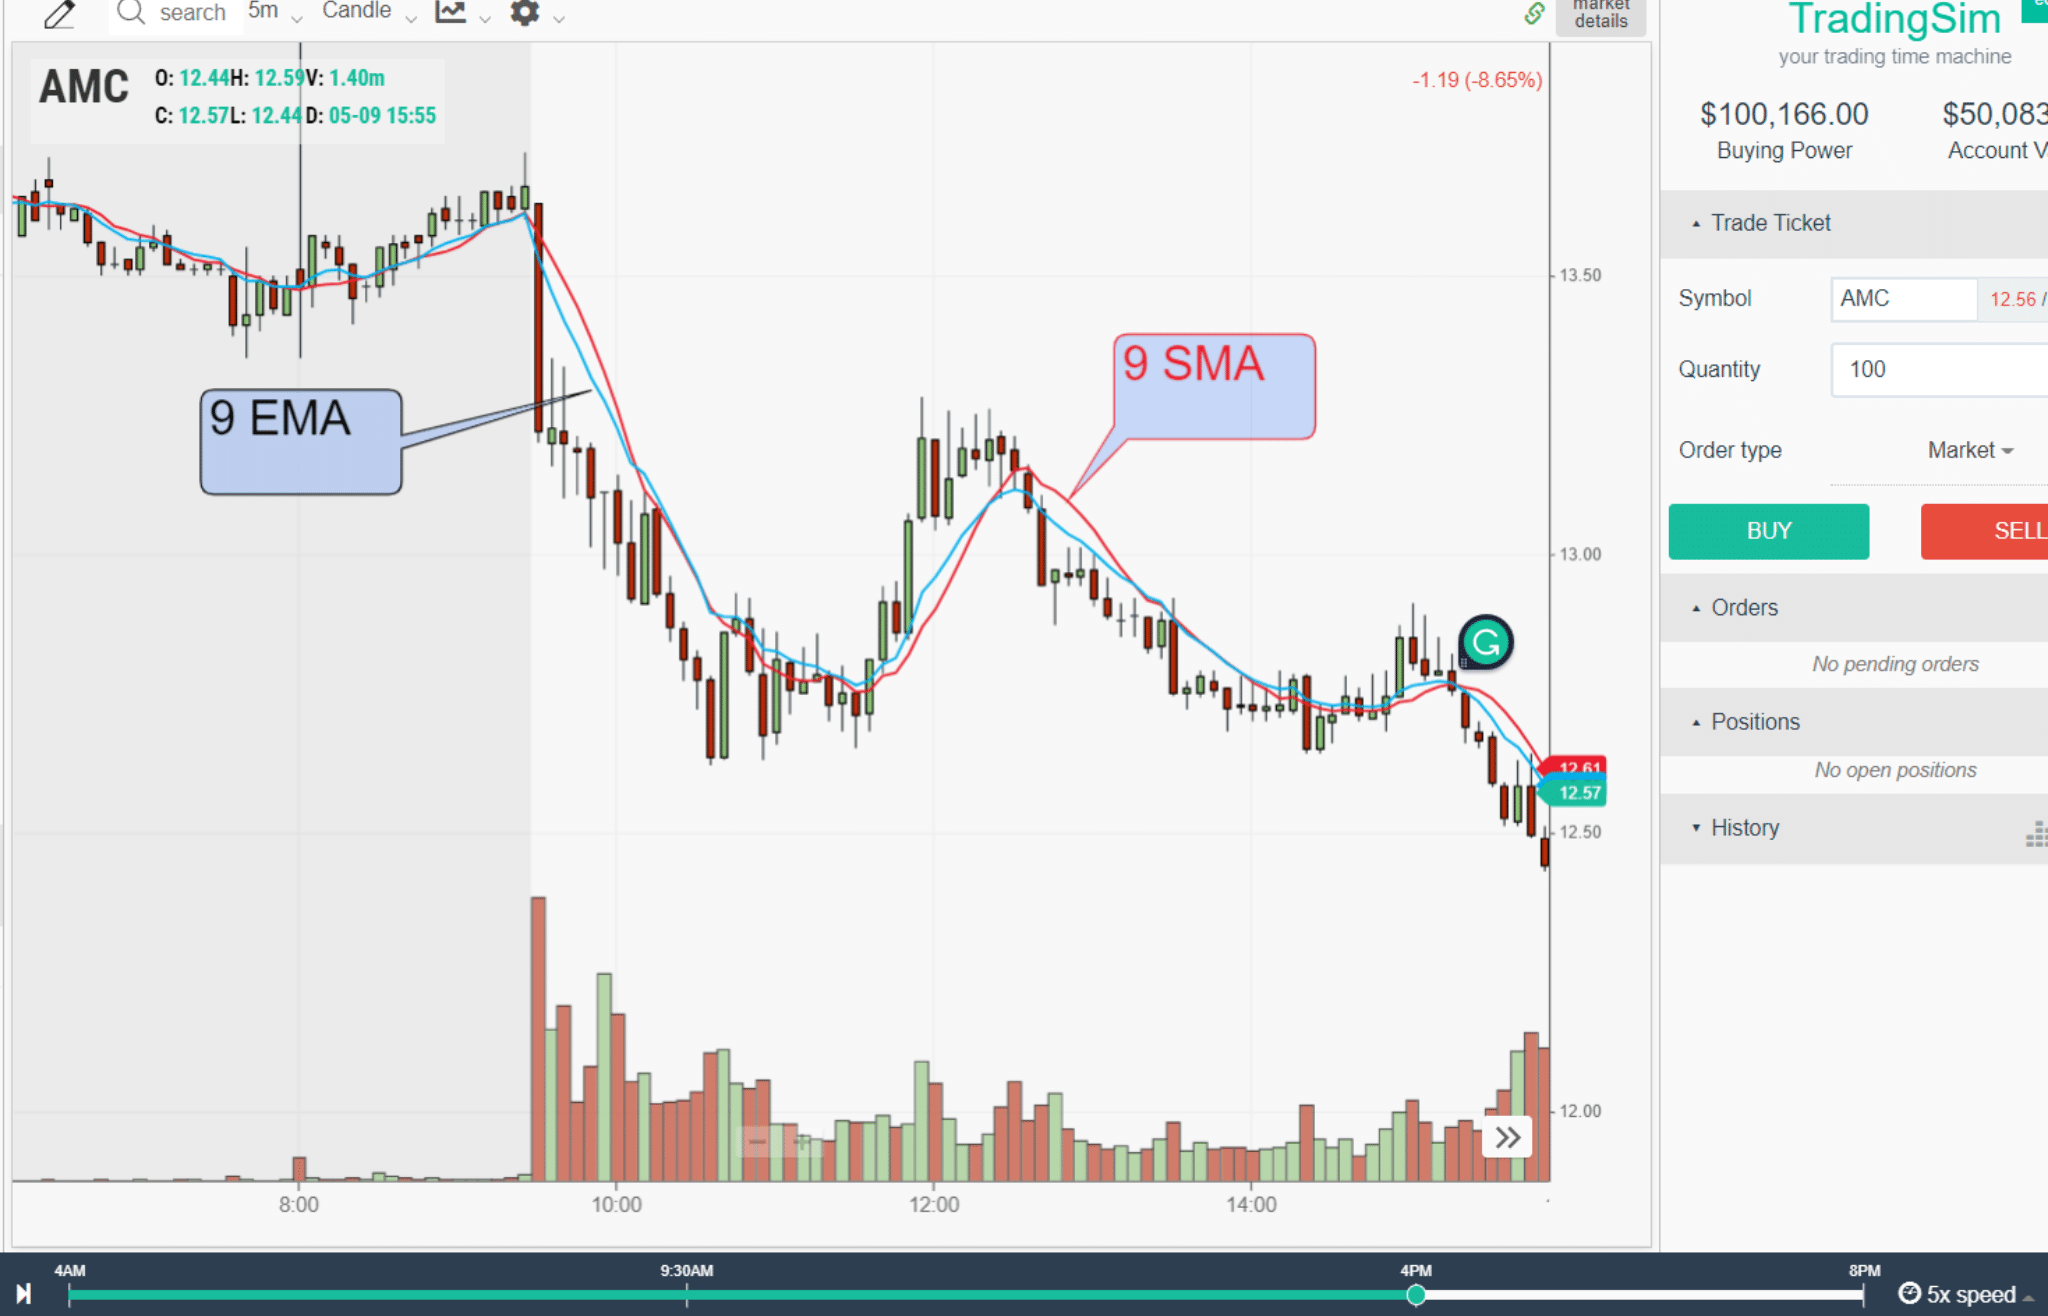
As you can see, there are some slight variations in the two. The blue 9EMA is a smoother line that reacts more in sync with recent price action.
When to Use the exponential moving average
Exponential moving averages are used when traders and investors need to know the current trend of a stock and where it might find support or resistance. Moving averages can also be used to determine when a trend might be ending. For that reason, it is best to use the EMA when you need to enter or exit a trade.
For example, longer-term investors might use higher time-frame exponential moving averages like the 50ema or the 200ema in order to determining the bigger picture trend. Often, they will wait for the 50ema to trend higher than the 200ema to confirm a new uptrend is starting. We call this the Golden Cross, and have written a great tutorial on the strategy.
The opposite of this strategy is the Death Cross, where the 50 crosses below the 200, signaling a potential decline in the market and a new downtrend.

How to use the exponential moving average in trading?
Another great way to use the exponential moving average is to gauge pullbacks in the current trend. Active traders love to find better entries in stocks when they pull back to moving averages like the 9ema or 20ema.
Linda Raschke, for example, has popularized the "Holy Grail" strategy, which is a strategy based upon buying or selling a stock that pulls into the 20 exponential moving average. If the general trend is up, you buy the pullback. If the trend is down, you short-sell the pullback.
Exponential moving average buy/sell signal
In this example, we have AMC, which continues its downtrend. However, it offers a great opportunity to sell into the pullbacks to the 20ema - the blue line. Your exponential moving average sell signal would be the break of the prior rally candle in the low-volume pullback to this area circled in blue. You can always confirm your signals with candlestick patterns as well.
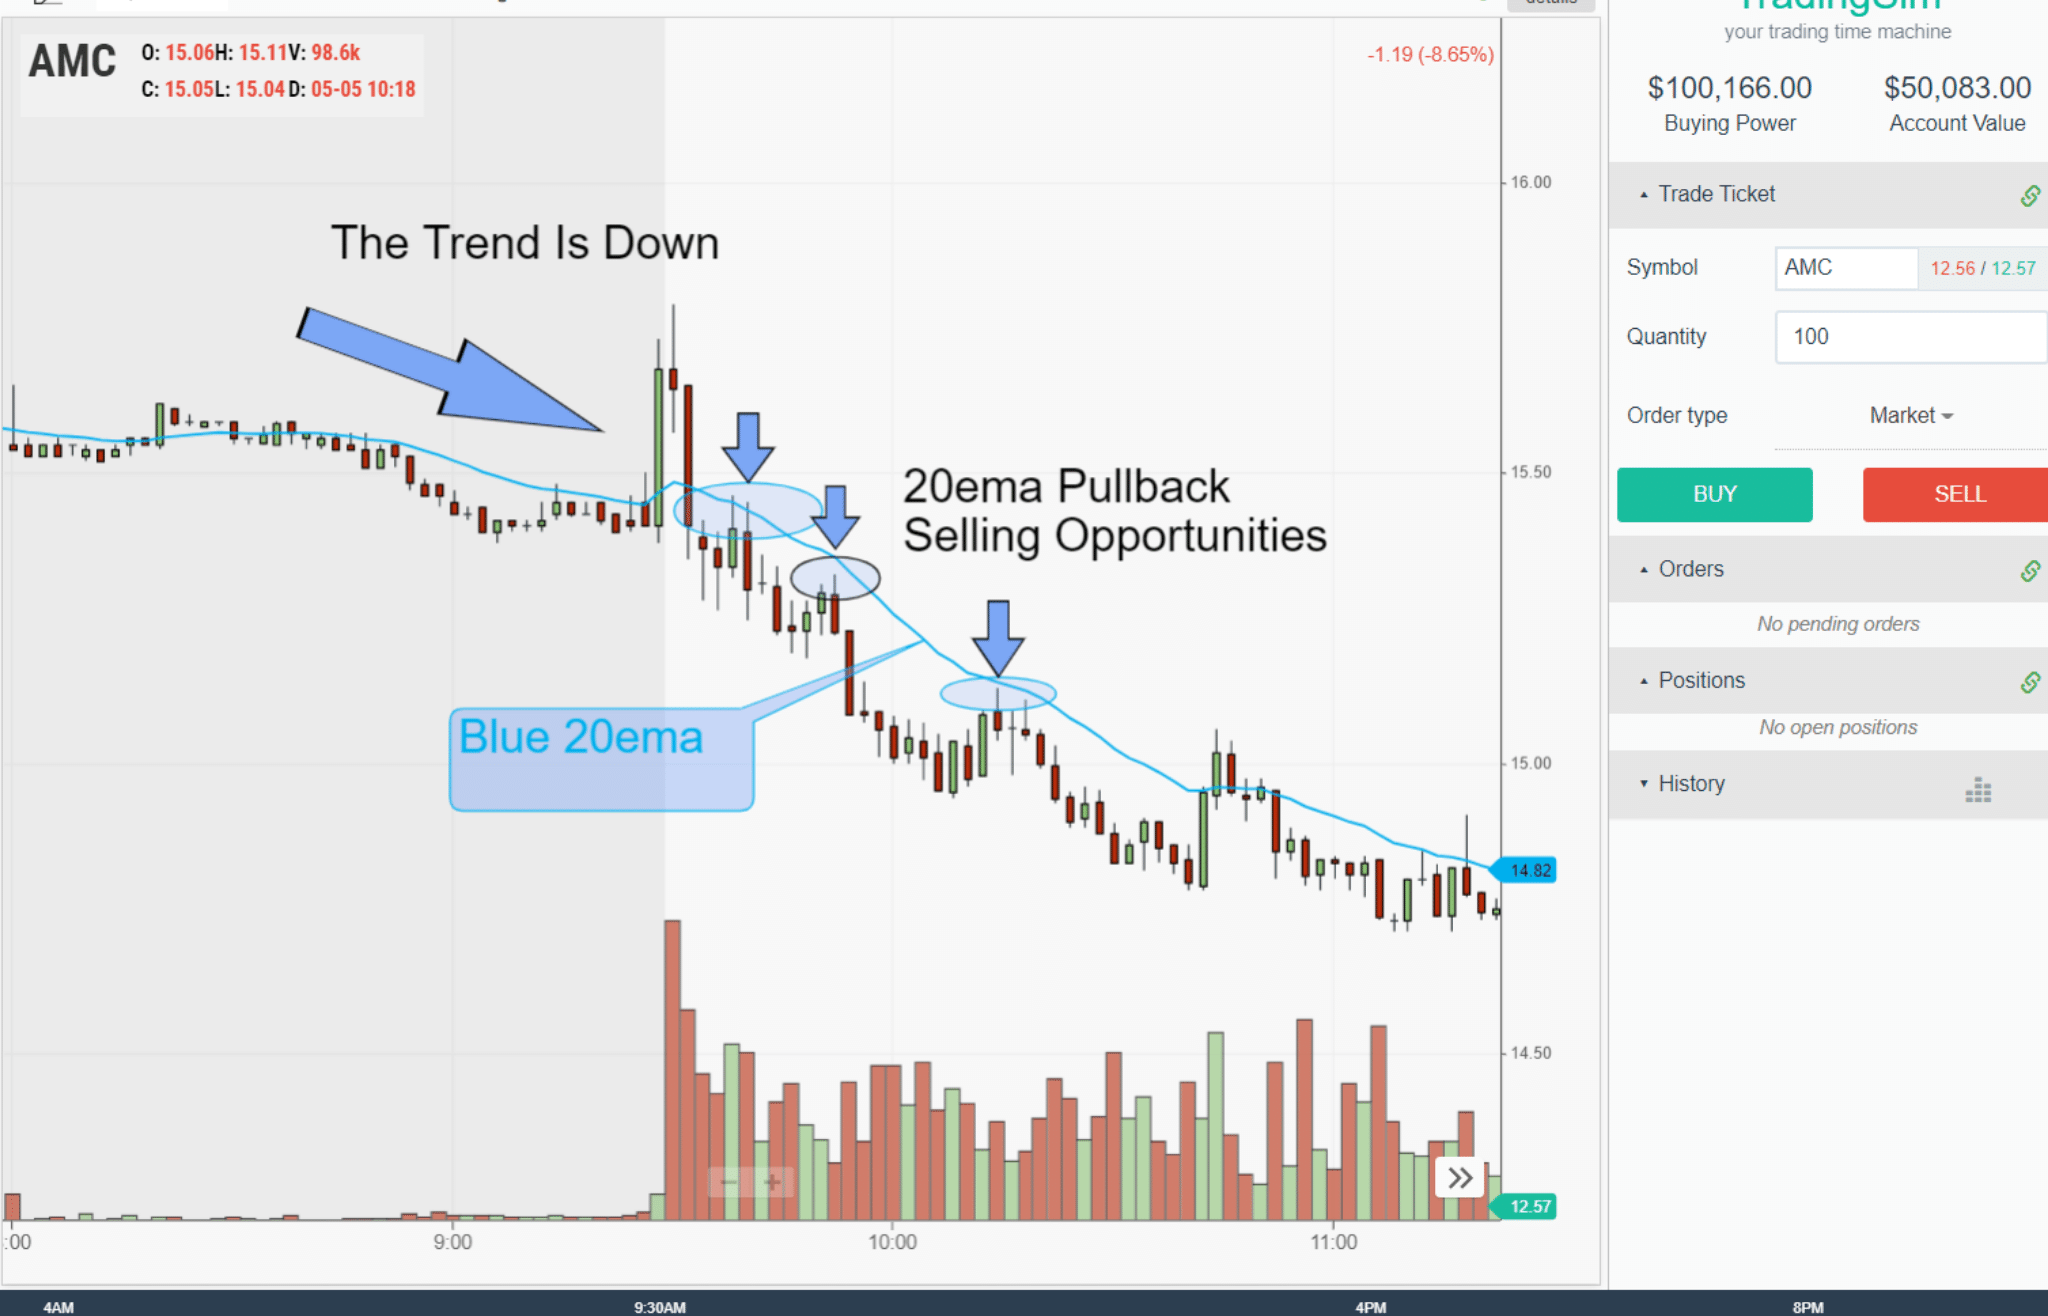
As you can see, no matter what the time frame, intraday or daily, you can use the exponential moving average to judge the character of a trend. This allows for great opportunities to join the trend while keeping your risk intact by putting stops just above the EMA.
For more on these pullback strategies, check our other tutorials on the 20 moving average pullback.
Which exponential moving average to use?
The most used exponential moving averages depend on the application and the time frame in which you want to trade. For example, the 50ema and the 200ema are used for longer time-frame trend analysis or swing trades. Other EMAs like the 12 and 26 are popular and used for indicators like the MACD (Moving Average Convergence Divergence).
Popular swing trader Scott Redler, who we interviewed on the SimCast, prefers the 8 and 21 exponential moving averages. Much of his short-term trading strategies are built around these time frames. Watch that episode here, you'll learn a lot.
Which exponential moving average for day trading?
We prefer to use the 9ema on a 5-minute chart intraday, along with a 20ema. For the longer time frames like the 50 and 200, we prefer a simple moving average instead. But here's the thing, the trick to knowing which EMA to use is really based upon the character of the stock you are trading.
What do we mean by that?
As you gain more experience in the market, you'll begin to notice that not every stock moves with the same indicators or price action. Each stock has its own character. Could this be because the market maker behind the stock prefers strange indicators to make their profit? Perhaps.
Regardless, we recommend not being a "prescriptionist" when it comes to relying on your EMAs. Instead, play around with them and find the "best fit" for the context and character of the stock you are trading. One stock may mind the 20ema to the penny, another might fit the 10sma. Be flexible in your approach to indicators.
Why Use exponential moving averages?
Exponential moving averages, and moving averages in general, provide a stable look at the average price of stock in a trending environment. Think of them as road maps on a curvy road. You might make a lot of right and left turns in the market, but your general direction could be north and south.
Moving averages smooth out a lot of the noise and allow you to stay on track. Then, when you think you are reaching your destination, the moving averages may tell you so, by flattening out or changing course.
Exponential moving average example
Let's visualize this in the market with another AMC example and analyze how the trend changed on a 5-minute chart intraday using the 20ema.
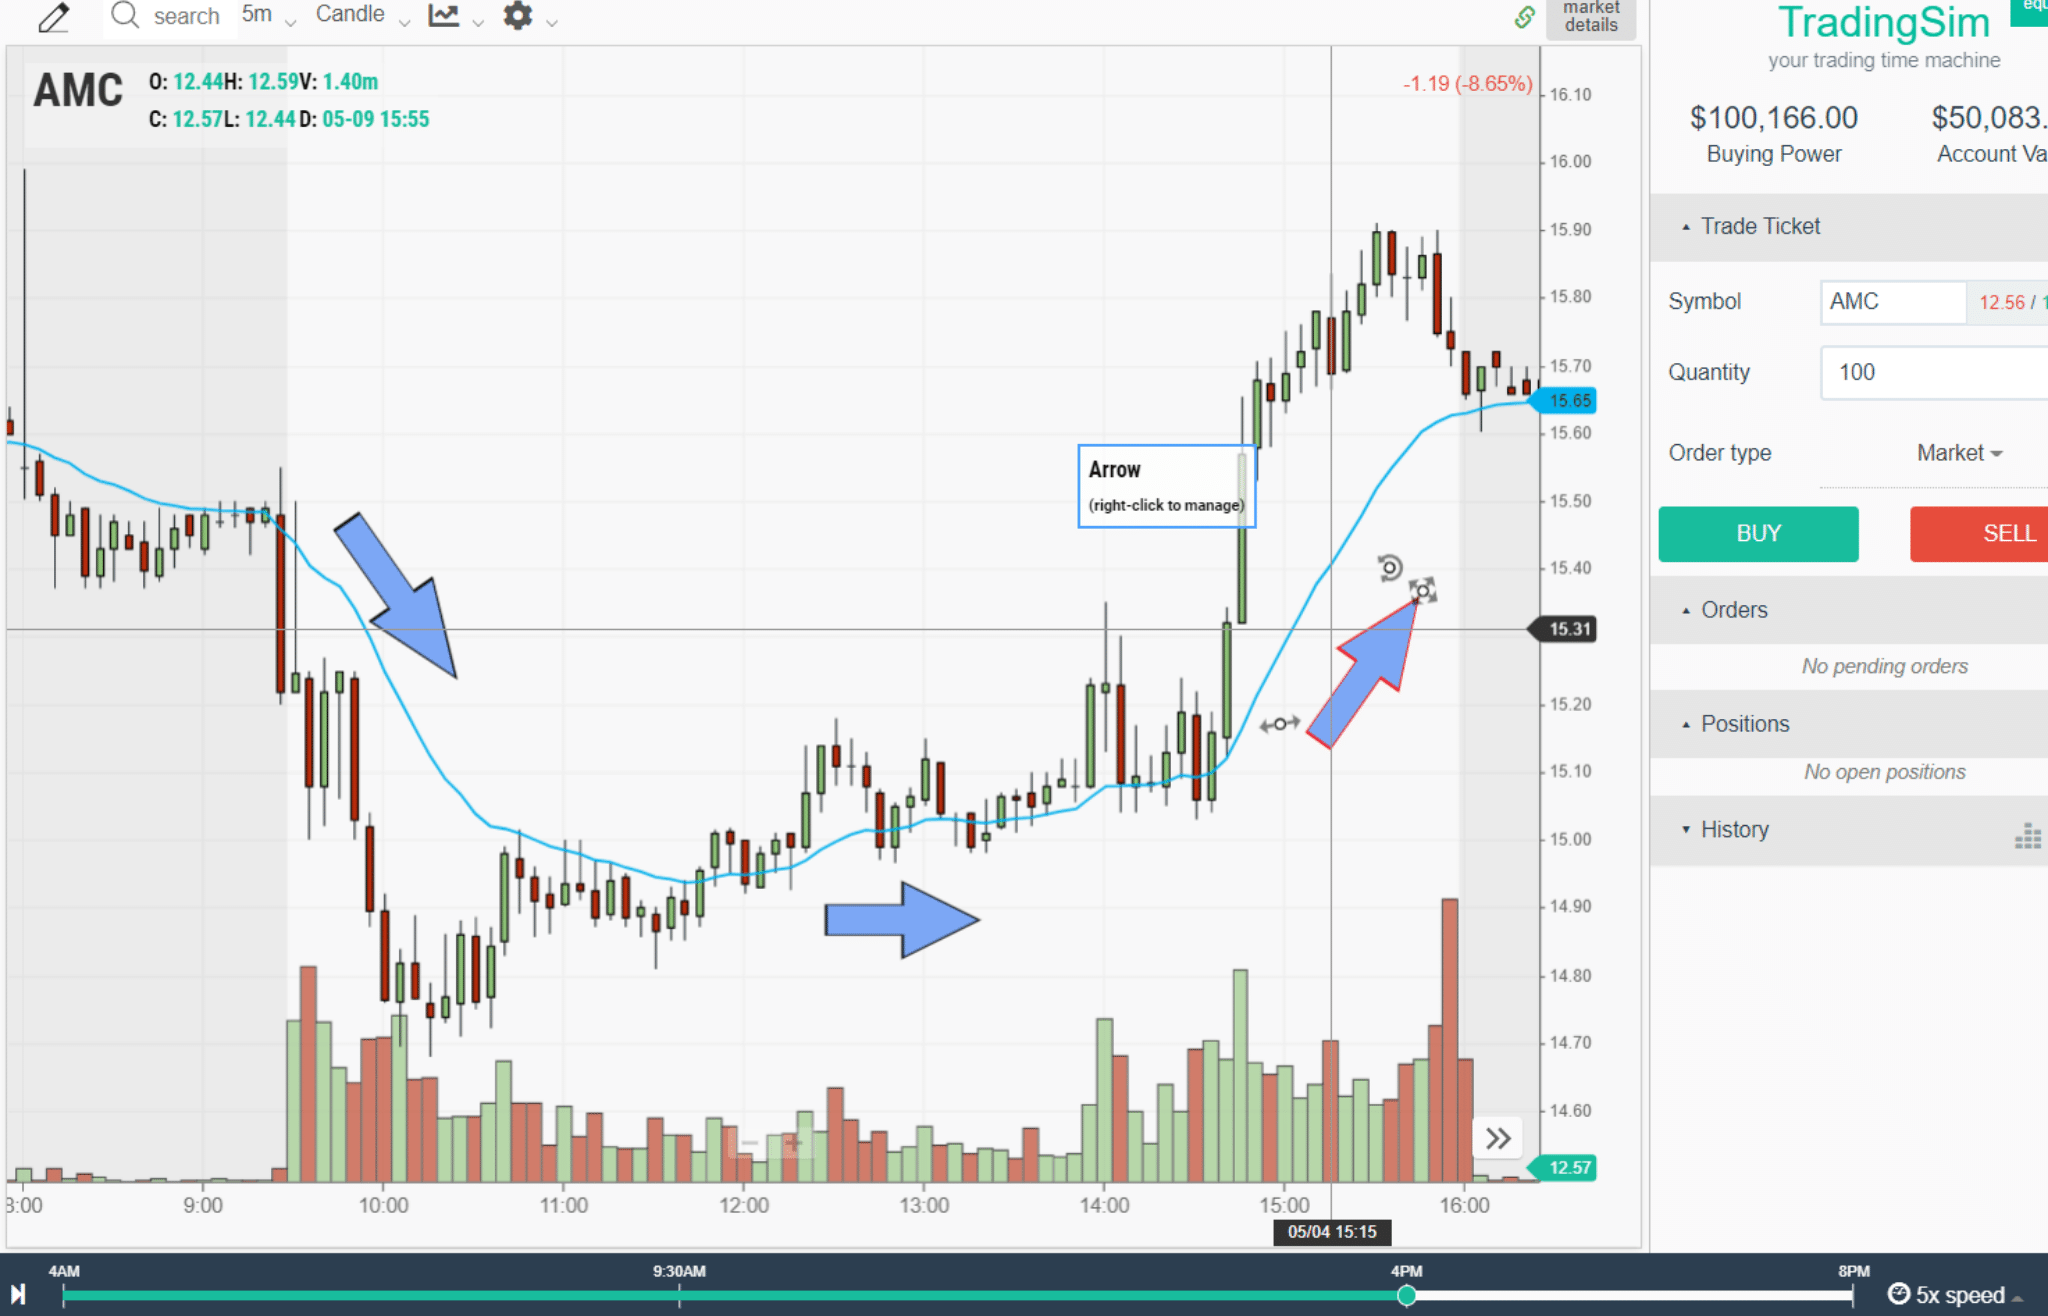
Notice in this chart example inside TradingSim that we have a well-defined downtrend, then a lot of sideways choppy action, followed by a new uptrend. Using moving averages can often help you avoid the volatility of trading ranges and keep you in a solid trending environment.
As traders, we are often wanting to catch the "meat of the move." Moving averages can help you do just that, allowing you an area to risk off of, and an area to target for your exits. That's why we use exponential moving averages.
How to learn with exponential moving averages
Our mission at TradingSim is to provide traders with the tools they need to build their own confidence in trading the markets. The best way to learn how to use exponential moving averages is to spend gobs of screen time analyzing how a stock reacts around moving averages.
In our simulator, you can view the biggest momentum stocks in the stock market using our historical scanner, for up to three years. Instead of waiting to trade the market every day, speed up your learning curve by analyzing each day's best momentum stocks and how they interact with their corresponding EMAs.
Here's a bullet-point list for you to try:
- Find the top 5 bullish and bearish stocks from the screener each day.
- Overlay the 9ema, 20ema, 50 and 200 moving averages on all time frames.
- Determine if the stock is in a new uptrend or downtrend on the 5-minute chart.
- Simulate a trade where you take a position in the prevailing trend direction based on one of the moving averages above.
- Calculate when you would best take profits on the trade.
- Analyze your results over a simulated subset of 50-100 trades.
We believe that the more you observe, the more you'll learn, and the better you'll be as a trader. Let us know how you do!

Quick Answer: What Is the Exponential Moving Average (EMA)?
The exponential moving average is a trend-following indicator that weights recent prices more heavily than older prices, so it turns faster than a simple moving average. Day traders use it to read trend direction, gauge momentum, and place dynamic support or resistance around price. Common EMA lengths on intraday charts are the 9, 20, 50, and 200 — the 9 rides the tape, the 20 marks the short-term trend, the 50 acts as the session trend filter, and the 200 represents the longer swing bias.
EMA vs SMA — Which One Should You Use?
- EMA reacts faster to new price, so it hugs trending markets and triggers earlier at turns. Best for momentum day trading and breakouts.
- SMA smooths equally across the lookback window, so it lags more but whipsaws less in choppy tape. Best for swing trading and confirming longer trends.
- Hybrid setup — many day traders put a fast EMA (9) with a slow SMA (50 or 200) to combine responsiveness with a slower trend filter.
Three EMA Signals to Watch
- Price pullback to the 20 EMA — in a strong intraday trend, a pullback into the 20 EMA that rejects with a high-volume bar is a high-probability continuation entry.
- 9/20 EMA crossover — a fast EMA crossing up through a slower EMA signals a short-term trend change. Crossovers work better after a clean consolidation than in already-stretched moves.
- EMA slope shift — a flat-to-rising 50 EMA on a 5-minute chart is a cleaner trend-day tell than chasing the first green bar. If the slope is flat, keep size small.
How to Practice the EMA in the TradingSim Simulator
Reading the EMA on charts is easy. Trading it in live tape is harder. Inside the TradingSim day-trading simulator, you can replay archived market sessions with full tick data and level-2 quotes, layer the 9, 20, and 50 EMA on any symbol, and rehearse pullback entries with real spread and slippage. Our moving averages reference covers the full lineup, and the simple moving average guide walks through where SMAs still beat EMAs.
A 10-Session EMA Practice Plan
- Sessions 1-3 — Observation. Replay three trend days with only the 9 EMA and 20 EMA on a 5-minute chart. Mark every pullback that held the 20 EMA and every one that broke it.
- Sessions 4-6 — Paper entries. Take long entries only on pullbacks to a rising 20 EMA with an inside-bar trigger. Stop under the pullback low. Target the prior high.
- Sessions 7-10 — Crossovers in context. Only take 9/20 EMA crossovers that happen after a flat base on the 5-minute chart, never into a climax bar. Log your R multiple and hit rate in a journal.
Frequently Asked Questions About the Exponential Moving Average
What is the best EMA length for day trading?
The most widely used intraday EMAs are the 9, 20, 50, and 200. The 9 and 20 EMAs on a 5-minute chart are the workhorse pair for short-term momentum traders. Longer EMAs like the 50 and 200 act as session-level and swing-level trend filters.
Is the EMA better than the SMA?
Neither is universally "better" — they solve different problems. The EMA reacts faster and is preferred in trending markets and momentum strategies. The SMA lags more but is steadier in choppy markets and is standard on longer-term charts. Many traders use both: a fast EMA for entries, a slow SMA for bias.
How is the EMA calculated?
The EMA applies a weighting multiplier to the most recent price, typically 2 / (lookback + 1). A 20-period EMA uses a multiplier of about 0.0952. Today's EMA = (today's close × multiplier) + (yesterday's EMA × (1 − multiplier)). The recursive formula is why the EMA "never forgets" older data but weights it less and less.
Does the EMA work on futures and stocks?
Yes. The EMA is price-based and works on any liquid instrument. On the TradingSim platform you can rehearse EMA setups on equities in the stock simulator and on the E-mini S&P, Nasdaq, and crude oil in the futures simulator. Adjust lookback to the timeframe you trade.
Should I use EMA crossovers by themselves?
No. Crossovers lag price and fire plenty of false signals in chop. Use them as trend filters alongside structure, volume, and higher-timeframe context. A 9/20 EMA crossover backed by a rising 50 EMA and expanding volume is far more reliable than a crossover alone.
Related Reading on TradingSim


 Day Trading Indicators


