Reading the tape is one of the essential indicators when active trading. Many traders know about the hundreds of indicators readily available on most trading platforms, but very few have an idea of how to read and interpret the tape. Interpret is the best way of describing how you need to approach your relationship with the time and sales window. Unlike other indicators which have oversold or overbought levels, reading the tape is specific to each situation.
This goes beyond how a stock trades, but how a stock is trading on a given day and at a given price level (e.g., 10, 25, 100). In this article, we will cover the basics of the time and sales window and tape reading (speed of the tape, size of orders, etc.). The tape is most important when validating breakouts and supply versus demand at critical price points. Once you have given this a thorough read, I highly advise you review the following related articles: (1) Psychological Support and Resistance Levels, (2) Day Trading Time Zones, and (3) Day Trading Breakouts. In each of the aforementioned articles, you will see how the tape provides validation to the price action, which will prevent the dreaded scenario we’ve all faced of being caught in the “trap.” Lastly, regarding tape reading, it truly requires the “gift of touch.” For those unfamiliar with this term, it means you do or use something so much; you begin to gain a sixth sense of when things are about to happen. Once you are ready to start practicing using the tape, you are going to need to log some quality hours with our trading simulator to hone the skill of reading the tape.
What is the Time and Sales Window?
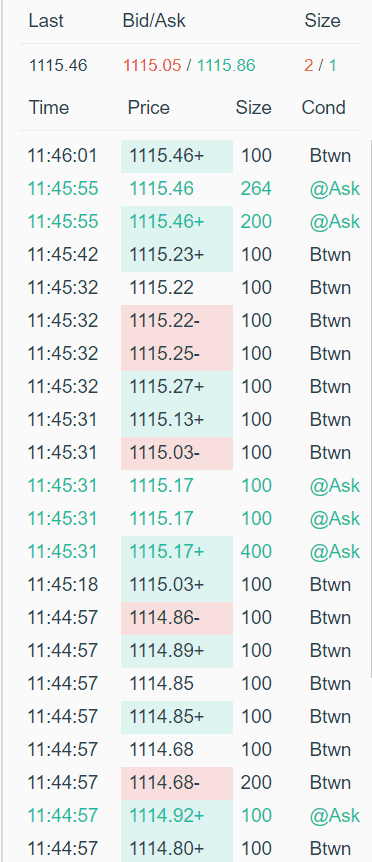
From my experience in day trading over the last few years, my most valuable tool became the time and sales window, aka. the “Tape.” The time and sales window shows the detailed trader information regarding the order flow for a particular security. The time and sales window provide details on each of the trades that have gone through for that security, such as Time of Trade, Price, Size of order, and condition of order. Depending on the trading platform, you will have other data points available to you.

Time and Sales Window
After mastering the message of the tape, you will be able to accurately decide when to enter and exit a trade.
How to Use the Time and Sales Window
I am a very big believer that there are two truths in trading stocks. One is price, and the other is volume. Tape reading involves both; and if used correctly, dramatically increases the odds of your trading working out. It does so because your goal with tape reading is to follow the money.
While some professional traders may not like to admit it, trading stocks is an odds game. Your job as a trader is to put trades on with the highest odds of winning. Trading with the tape requires trading with patience. You cannot go out and buy or short a stock because you see the tape speeding up a bit. You need to be aware of support and resistance levels and also combine the message of the tape with price pattern formations.
Tape reading can be very fast and confusing at times and requires quite a bit of practice to get used to understanding the true meaning behind what you are seeing. Remember, every stock is a different story and tends to trade differently. It is wise to review the way in which the “tape” trades for a couple of minutes before entering a trade. Reading the tape requires you to train your eyes to scan for changes in character. I want to discuss a few of these key changes that you should take note of:
Size of Orders
Let’s start with size. The size of the orders coming through will help you decide if there is conviction behind the price action you are seeing. When putting on a trade, you typically want to see a flurry of buy or sell orders which have greater than 300 to 400 shares in size. There is no hard and fast rule about this; it is more of a visual cue that your eye gets trained to recognize. Many times, I will see great technical setups in stocks that trade low volume. I stay away from these setups as the message of the tape is not as clear, and this lowers my odds of a winning trade.
Order Speed
The speed of the orders is another key component to the message that the tape is giving you. Typically, when stocks breakout through support or resistance levels, not only will the size of the orders go higher but you will see the tape start to speed up. This gives you an indication that there is an interest in this stock at this level and that the interest is larger than a couple of small traders buying or selling.
Order Condition
Order condition refers to which side of the bid/ask spread the trade was executed on. When we go long a stock, we want to see many orders being executed at ask. Conversely, when we go short, we want to see orders being filled at bid. This gives us a clue as how desperate traders are to get into our out of this stock.
Speaking from Experience…
Above, I have reviewed a few basic principles of tape reading, but I want to discuss some of the lessons I have learned throughout my years of trading that I think you will find helpful when analyzing the tape.
Which stocks are best to trade?
I have received this question many times. The answer to this question for me is simple; I only trade the most volatile stocks of the day. These stocks are the ones which will provide you with strong volume and large interest from the public. They also provide strong and fast moves which you can make larger profits from. Remember, we need to see speed in the tape, and that requires a stock with public interest.
Does the tape work better during specific times of the day?
In my experience, the answer to this question is YES. I typically only trade the first 2 hours of the day. This is when the most volatility is present in the market and also when most of the trending moves are made. Typically, lunchtime produces a choppy market and has a different group of traders who are buying or selling for different reasons than the first hour. I am not ruling out trading after lunchtime. However, my results have been less than stellar when I attempted to do so.
Tape Reading with Level 2

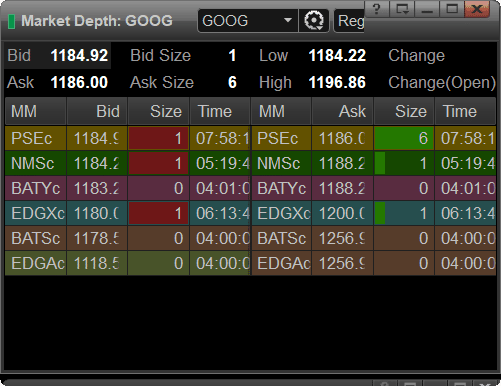
Level 2
The level 2 window provides the trader with an edge. It will show you the sizes of the orders in the market makers book. While the market makers can play games with level 2 to fool traders, in general, you want to see high bid sizes and low ask sizes when you go long. On the flip side, you want to see low bid sizes and high ask sizes when you go short or sell out of a stock. Again, it’s not foolproof, but it adds to the odds of your trading winning.
Exiting a trade
This is probably the most difficult part of the trade for most traders. Tape reading helps me get out of the trade by looking for imbalances. When I see a stock moving sharply in one direction, I will immediately look to the tape to offer clues as to when the brake pads will be applied. Again, this skill will take practice to develop. If your short a stock, keep an eye out for the bid side getting heavy and the bid/ask spread widening. This could be a tell-tale sign that the juice has been used up.
Bid/Ask Spread at Key Levels
Make sure that stock does not have large bid/ask spreads as it approaches your entry points. You will not have much time to place your trade, and if you are trading a volatile stock, you most likely will have to execute the orders at market. Large spreads tell me two things; first, your risk increases significantly when the spread increases. Why? Because most times you will have trouble getting out of a stock with a large spread using limit orders and this can turn a small loss into a big one quite quickly. Secondly, it tells me that there is not that much interest in the stock. If there was, the spreads would narrow, and both sides would come as close as possible.
Extremely High Volume Stocks
There is trading high volume, and then there is trading extremely high volume. I try and stay away from stocks that trade, for example, 30 or 40 million shares as the message of their tapes can be a bit confusing at times if you are a beginner. You may see 14 orders come through at bid with large sizes, but that may not mean as much as if the stock was trading less volume. Remember to always keep everything in context. If your stock trades gigantic volume, you should expect a different kind of tape action.
Make price prove the point
Up to this point, we have discussed order size, speed, and condition. While these are all key components of the tape, you must let price prove the point. For example, if you are looking to short a stock at $54 and there is strong order flow selling at bid at that level, my experience has shown me to wait for that level to break. If it does not, you may be involved in a trap that was made to get the weak traders out and then take the stock in the opposite direction.
Don’t let your ego get in your way
One of the biggest mistakes that I see many traders making is that they get attached to their positions. To appease their ego’s, they tend to take a trade and stick with it until they are right. Remember, day trading is an extremely fast game, and if you do not react with speed, you will be left in the dust. When you make a decision based on that tape action and the stock does not go in your favor relatively quickly, the odds are that you are in a bad trade.
Focus
It is extremely important to have utmost focus when you are trading and trying to listen to the message that tape is giving you. Try and stay in a zone and filter out the extra noise. If you are going to put a trade on, be in that trade and nothing else. This will help you feel when it is right to stay in the stock and when its time to get out.
Conclusion
Tape reading is a very important skill to have as a short-term trader and can keep you out of many bad trades. Remember, don’t be an action junkie, psyching yourself up for every trade.
If you do this, you will find a reason to put on bad trades in the heat of the moment. Discipline is key and it takes time to develop. For any new traders looking to try this out, please practice, practice, practice before you put your hard earned money at work. Mastering the art of tape reading will take time, but when you do, you will be rewarded.


 Volume Indicators
