It is a common thought that you can only identify support and resistance levels using price.
Well, this is partially true. When you think of support or resistance levels, you are likely talking about a swing high or a price point on a trendline.
In addition to these levels, there are also psychological levels which can impact price movement.
Psychological Support and Resistance Lines

Psychological support and resistance lines occur not because of the perceived importance of a particular technical level. Humans are naturally attracted to whole numbers.
In addition to whole numbers, we also gravitate to round numbers that end in 0 and for lower-priced stocks, 25 or 50 cent increments.
Below gives you some indication of how this works.
Stocks Below 10 Dollars
50 cent increments and Dollar Increments
$2.50, $3.00, $3.50, $6.50 AND $4.00, $7.00, $9.00
Stocks Above 10 Dollars
$1 Dollar Increments
$12.00, $14.00, $18.00
Stocks Above $50 Dollars
$5 Dollar Increments
$55, $65, $75
Stocks Above $100
$10 Dollar Increments
$110, $120, $150
Do you see any patterns?
Beyond the increments increasing in size as you go higher in price when the price ends in 0 and 5, it’s an area where traders look to book profits.
Why Does This Phonemoneon Occur?
Pricing is Everywhere
Again, we are raised from a young age to think of whole numbers in every aspect of our lives and numbers that end in 5.
For example, when I was a kid, pay phone calls were 25 cents.
Even when people are selling to you, they stay away from nice round numbers like 100. Companies will sell you something for 99 dollars because it feels like you are getting a better deal.
Well, the market is no different. People see that huge $!00 price tag and say, this is where I am going to get out. It’s just an obvious psychological price point.
The Media Cheers the Big Round Numbers as Well

Financial News Media
The market analysts cheered for Dow 10,000 as if it was going to solve all of our worries. The same thing happened again when the Dow crossed 20,000.
There were people talking about it on a daily basis. It pretty much got to a point the market was just pushing up to this level regardless if the financials for these companies supported such a lofty target.
How Does This Apply to Day Trading?
How does all of this impact your trading? That’s only a question you can answer.
For some traders, they build entire systems and strategies around selling at whole numbers. I’m not saying you should run scared or load up the short bus at round even numbers. However, I would recommend you pay attention to these key levels.
For me, if I’m trading a stock under $50 bucks, I am fully aware of any dollar increment.
I only trade long, so if a stock, for example, crosses above $10, I am keeping a close eye on the tape to see if there is enough juice to hold the level or if the stock will fall back to single-digit territory.
For the lower priced stocks, I feel like 50 cent increments are also huge.
Chart Examples
$50 Dollar Stock
Let’s look at a few chart examples to see how this phenomenon plays out in the market.
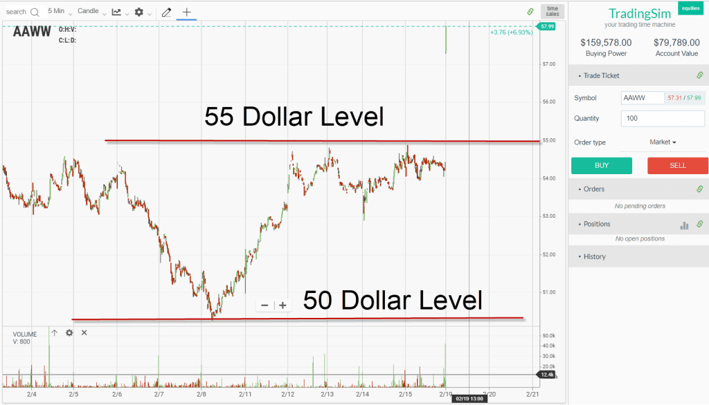
5 Dollar Increments
Above is a 5-minute chart of AAWW. As you can see, 50 acted as major support after a 10% slide down. There was no support anywhere, and then magically 50 put a stop to the bears run.
What happened next? The stock ran up to the $55 dollar level and began to consolidate. Do you think there is any coincidence in that you are trading a $50 dollar stock and it finds resistance at the halfway point of a $10 dollar increment ($55)?
Again, you cannot go out there and place buy and sell orders every time a stock touches $50, but you should be aware that the level is in play.
Stock Under $5 Dollars
In the next example, we will review a penny stock and how the security reacts to 25 cent increments.
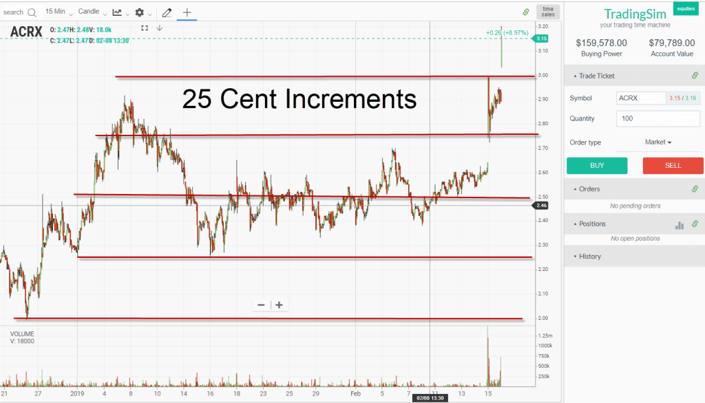
25 Cent Increments
In the above example of ACRX, the stock moved in clear 25 cent increments. At 2 dollars, the stock put in a major bottom. It then zig-zagged a number of 25 cent increments up to the $3 dollar level.
The stock then experienced a major breakout above $3 dollars that appears ready to catapult the stock higher.
I know these levels can make your chart start to look a tad busy, so you will need to determine which intervals are important for you. For example, you may only care about whole numbers (numbers without decimals).
So, in that case, for penny stocks, you may only care about the 1, 2, 3, 4 and 5 dollar levels.
How Can Tradingsim Help?
Each security may react differently to these whole number levels, so you will need to validate how to implement a winning strategy. You can practice trading these setups in Tradingsim in order to find the right mix of volatility and the right increment to see what works best for your trading style.
To learn more about psychological support and resistance levels, check out this YouTube video.
Photo Credit
Source: pixabay.com
Photo by bruce mars


 Day Trading Indicators


