5 Minute Charts Explanation and Guide + Three Free Setups
Nov 27, 2021
Written by: Al Hill
✓ Reviewed by Kunal Vakil, Co-Founder of TradingSim · Updated Mar 31, 2026
In this article, we will cover everything you need to know about 5-minute charts. First, we will touch on the basics of the 5-minute chart. Next, we will move onto two popular chart patterns using the 5-minute charts. Lastly, we will cover advanced trading techniques of combining indicators and multiple time frames.
5-Minute Bar Definition
5-minute charts illustrate the summary of a stock’s activity for every 5-minute period within the trading session. The core market session is 6.5 hours per day [1]; therefore, a 5-minute chart will have 78 five minute bars printed for every full trading session.
Day traders are commonly trading 5-minute charts to identify short-term trends and execute their trading strategy of choice.
Where to Select the 5-Minute Time Frame
Most trading applications will allow you to select the time frame to analyze price data. Within the Tradingsim platform, you can select the 5-minute interval directly above the chart.
Select 5 Minutes
The close on 5-minute charts gives insight into the immediate market direction of the trend for a stock. When a stock closes at the low or high of the 5-minute bar, there is often a short-term breather where the stock will go in the opposite direction.
The psychology behind this is that the stock has been pushed to an extreme as other active traders chase the price trend. This breather can mark a major reversal, but in the majority of cases, it creates the environment for a counter move.
How Do You Trade 5 Minute Charts?
Bar any exhaustive scientific studies, we would dare to say the 5-minute chart is one of the most popular time frames for day traders.
5-minutes provides you with the right mix of monitoring the details, without scalping, and conversely allowing you to avoid waiting for 10, 15, 30 or 60-minutes to pull the trigger as well.
It’s that fine line where most traders feel comfortable within this time unit of measure. It also quietens the noise of 1 and 2 minute charts.
Now, let’s dive into a few strategies you can use with this time frame.
The Morning Reversal Strategy
Most of the liquidity and trading activity in the market occurs in the morning and near the close [2].
In the morning, stocks will trend hard for the first 20-30 minutes into the 10 am reversal time zone. Day traders that are looking to go opposite to the trend can wait for a close at the high or low of the 5-minute bar to go opposite to the morning move.
The morning reversal short has a high success rate. There is something about the retail trading market in the morning that brings a fresh batch of bag holders chasing the market for quick gains every morning.
The smart money will grab the breakout and ride the market for quick profits. However, new traders will either hold on too long or jump on the bandwagon too late, perhaps on a breakout that fails like this OCUP example below:
Bearish Engulfing Morning Reversal
The 5-minute chart time frame is often too large to capture the volatility of the move heading into the 10 am reversal. This can be a blessing or a curse depending on how you like to trade.
Let’s review another chart example of a morning reversal where the stock climbs higher, only to reverse lower. This pattern is actually more common than you would think.
Morning Reversal
This is the 5-minute morning reversal you are going to see most often. There is a slight pop in the morning and then after a move higher, a sharp reaction lower.
As you can see from the spinning top at the 6th 5 minute bar of the day, we have supply entering the market. We then get a breakout from that level that fails — a great opportunity to get short.
As always, treat trading 5-minute charts in the morning seriously, especially on the short side. Always put your stops in.
Trading Breakouts
In addition to pullback trades, breakout trades are also a big part of active trading. For these setups, you want to find stocks that are up considerably in the pre-market or with volume right off the open.
Next, you want to make sure they have little to no overhead resistance.
If you are open to more risk and would like to reap more rewards, then you will want to set your eyes on low float stocks.
If you are looking to play things a little safer, then look to stocks with a float north of 100 million shares.
If you trade pre-market, then your range can develop in the early am and you could be in a trade as early as 9:31 in the morning. However, if you do not use pre-market data, you will want to focus on the opening range.
Next, you want a stock with volume that can push the price higher [3].
Lastly, you shouldn’t fall in love with these high flyers. Most of them will run their course in ten to thirty minutes.
So, remember to keep your stops tight and to take profits as the stock goes higher.
5 Minute Chart Morning Breakdown Example:
5 Minute chart breakdown
These breakout trades also work on short positions. In the above chart, notice how VLON broke down after already having a strong gap to the downside.
After a while, certain patterns will emerge that you can use to improve the accuracy of the trades you place.
In the next section, we are going to go beyond chart patterns and dig into various indicators you can use with 5-minute charts to find profitable setups.
How to Enter and Exit Trades on a 5-Minute Chart with Oscillators and Fast Lines
Oscillators do just that, they oscillate between high and low extremes.
“Most traders are told to use Stochastic as an Overbought exit or sell short signal, and an Oversold entry or buy signal. This simplistic approach worked well prior to the 1990s and the advent of electronic trading plus massive institutional trading activity. However, this is far too simple an approach for the faster-paced more dynamic and complex marketplace of today, where short term trading dominates more than ever.” [4]
Since they are leading indicators, oscillators point out that a trend might emerge, but it is no guarantee.
For this reason, oscillators are one of the most attractive tools for day traders as timing is of the essence.
Nevertheless, if not used properly, they often lead to failure. Therefore, we recommend combining two oscillators when trading on a 5-minute timeframe in order to validate trade signals.
Personally, we like oscillators only for trade entry and not trade management.
Therefore, we recommend you include a fast line on your chart in order to attain exit points on 5-minute stock charts. Some of these lines could be a regular Moving Average, DEMA, TEMA, Hull MA, Least Squares MA, Arnaud Legoux MA, etc.
In this section, we will cover 3 simple strategies you can use with 5-minute charts and indicators.
Strategy #1 – Stochastic Oscillator + RSI + Triple EMA
This simple strategy uses a three-pronged approach across two oscillators and an on-chart moving average indicator.
Entering a Trade
Trade entry signals are generated when the stochastic oscillator and relative strength index provide confirming signals.
Trade Exit
You should exit the trade once the price closes beyond the TEMA in the opposite direction of the primary trend.
There are many cases when candles move partially beyond the TEMA line. We disregard such exit points and we exit the market when the price fully breaks the TEMA. Have a look at the example below:
5-minute chart with oscillators
This is the 5-minute chart of General Motors. The two instruments at the bottom of the chart are the Stochastic Oscillator and the RSI. The TEMA is the green curved line on the chart. The green pairs of circles are the moments when we get both entry signals.
How to Use the Indicators
First, we spot overbought signals from the RSI and the stochastic and we enter the trade when the stochastic lines have a bearish crossover. We go short and we follow the bearish activity for 15 full periods, which is a relatively long period of time for a day trader. Good for us!
We exit the trade once the price closes above the TEMA. This short position generated a profit of $0.43 (43 cents) per share, which is a decent amount even for advanced trading strategies.
Later, we receive a few more overbought/oversold signals from the stochastic, but they are not confirmed by the RSI. Thus, we stay out of the market until the next RSI signal.
Our second trade comes when the RSI enters the oversold area just for a moment. This long signal is confirmed by the stochastic, so we go long. The bullish move that ensued is minor, but still in our favor!
We hold this trade for 9 periods before closing the position. We exit the market when a bigger bearish candle closes below the TEMA with its full body. This long trade brought us a profit of $0.09 (9 cents) per share.
On the next day, we manage to identify another long signal from the stochastic and the RSI.
We hold the long position open for 14 periods before one of the bearish candles on the way up close below the TEMA. This long position generated a profit of $0.46 (46 cents) per share.
Notice that in this stock trading setup we have no on-chart trading indicator for identifying exit points.
The reason for this is that the MACD does a pretty good job of this itself. We will simply exit the market whenever the MACD has a crossover in the opposite direction!
Notice that when using the MACD for exit points, you stay in the market for a longer period of time.
5-minute chart + MACD + MFI
This is the 5-minute chart of McDonald’s for Sep 30, 2015. The two instruments at the bottom of the chart are the MACD and the Money Flow Index. The green circles indicate the entry signals we receive from the two indicators. The red circles indicate the moment when the MACD tells us to get out of the market.
Notice that in this example, the exit point of a position is the entry point of the next one. Thus, the red and the green circles match in three cases.
How to Use the Indicators
In the first trade, we have matching bearish entry signals from the MFI and the MACD. We short McDonald’s.
Although there is strong hesitation in the price movement, no exit signal is provided from the MACD and we hold our position. Later on, the price moves in our favor and we close the trade when the MACD has a bullish crossover. We were short for 34 periods and generate a profit of $0.33 (33 cents).
As we said, in this strategy example, we often open a contrary position right after closing the trade. Therefore, once we received the exit crossover from the MACD, the MFI gave us a long signal.
We stay in the market for 36 periods until the MACD gives us a bearish crossover. We collect a profit of $0.56 (56 cents) per share from this trade – slightly better than the previous example.
The MFI is already high and we immediately open a short position after the MACD crossover from the previous position. McDonald’s starts to move in our favor, but the direction changes rapidly. Yet, the two lines of the MACD interact, but they do not create a crossover. Thus, we hold our short position for 39 periods.
In this trade, we accumulated a profit of $0.81 (81 cents) per share – much better!
With the exit of the previous position came the entry point for the next trade. This is so because the MFI was already down when the MACD exit crossover appeared. Thus, we go long and we enter the best trade of the four! We hold McDonald’s for 27 periods before the MACD gives us a bearish crossover. This long position generated a profit of $0.88 (88 cents) per share. Well, that my friend is a good trade!
Strategy Results
4 Positions
2 long
2 short
Time in the market: 11 hours and 20 minutes
Total profit: $2.58 per share
Strategy #3 – Klinger Oscillator + RVI + 12-Period Least Squares MA
This 5-minute chart strategy involves the Klinger Oscillator and the Relative Vigor index for setting entry points. We try to match long and short signals with the two oscillators, which will be an indication to trade the equity. When we get these two signals, we open a position and we hold it until we see a candle closing beyond the 12-period LSMA.
5-minute chart + KO + RVI + LSMA
This is the 5-minute chart of Yahoo. The two instruments at the bottom are the RVA and the Klinger. The blue curved line on the chart is the 12-period LSMA. On this chart, we have four trades. The green circles show the four pairs of signals we get from the RVA and the Klinger.
How to Use the Indicators
First, we get a bullish signal from the Klinger, which is confirmed by the RVA after 4 periods. When we get the confirmation, we go long. We manage to hold the trade for four candles before we see a bearish candle below the LSMA. We get $0.10 (10 cents) per share from this trade.
Four periods later, the Klinger and the RVA give us bearish signals at once and we go short. We get a slight bearish move of four periods before a candle closes below the LSMA. We generate $0.12 (12 cents) per share more.
The third trade is the most successful one.
Six periods after the previous position, we get matching bullish signals from the Klinger and the RVA. Thus, we go long with Yahoo. We manage to stay for 9 periods in this trade before a candle closes with its full body below the 12-period LSMA.
Notice that at the end of the bullish move, there is another bearish candle, which closes below the LSMA, but not with its full body. Therefore, we disregard it as an exit signal. This long position brings us a profit of $0.37 (37 cents) per share.
With the next candle, we get bearish signals from the RVA and the Klinger and we go short with the closing of the previous long position. We get out of this trade after 5 periods when a bigger bullish candle closes above the LSMA. This trade generated a profit of only $0.03 (3 cents) per share.
Strategy Results
4 Positions
2 long
2 short
Time in the market: 2 hours and 10 minutes
Total profit: $0.62 (62 cents) per share
Which 5-minute bar trading setup is better?
The trading strategy we prefer when trading 5-minute charts is the MACD + MFI. The reason for this is that this strategy distributes the trading along the entire trading day.
In the example above, we covered the whole day with only 4 trades. Furthermore, we generated an impressive amount per share!
In the other two strategies, the number of trades per day will be significantly more. As you see with MACD + MFI, we traded 4 positions for 11 hours, while with Klinger, RVI, and LSMA, we traded 4 positions for only 2 hours.
Yet, some of you will like fast-paced trading and will like to exit the market more frequently. Just remember in trading, more effort does not equal more money.
Using Multiple Timeframes
One thing you will want to do with 5 -minute charts is to use multiple time frames to help support your point of view.
In reality, 5-minute charts are great for stocks with lower volatility. However, if you are trading low float stocks you will want to use a one-minute or two-minute chart to track price movement.
While you are monitoring price movement on a lower level, you will also need to monitor the bigger trends.
To do this, you will want to look at a daily or hourly chart.
So, when you are setting up your trading desk, have multiple charts up of the same stock. Below is a screenshot from Tradingsim of an example of how you need to view stocks on multiple time frames.
Multi-time Frame View
In the above chart, notice how VLON has three time frames, 2-minute, 5-minute and daily.
The 5-minute chart is your anchor and was showing a consolidation was taking place. The two-minute chart also displayed a similar consolidation pattern.
Lastly, the daily chart shows that after a nice run-up, VLDN was starting to stabilize after a retracement of the rally.
So, in this example, as a trader, the big thing you are looking for is alignment of the same narrative across multiple time frames.
Summary
Even if you are not trading 5-minute charts, it is essential that you keep an eye on them. The majority of day traders are using 5-minute charts to make their trading decisions. Therefore, these traders tend to control the action.
If you are trading with 15-minute charts, be mindful that a sharp counter-trend move can occur at the close of a 5-minute bar.
Remember, a close at the high or low of a 5-minute bar is a potential indication that a minor reversal is in play. Day traders should not immediately exit their winning position but should rather look at this as a sign of a potential trend change.
Also, the morning is where all the action takes place in the market. If you are going to trade during this time of day, remember the two most common setups – pull back and the breakout.
Lastly, 5-minute charts can’t do it all by themselves. You will need to assist help from other time frames. The one minute chart for very volatile stocks and the daily charts to identify long-term trends for support and resistance levels.
Alton Hill is the Co-Founder of TradingSim with over 18 years of trading experience. He completed the Design Thinking Bootcamp at Stanford’s D.School and brings expertise in Product Development to create the best trading simulation experience. His strategy focuses on trend-following systems, targeting high-volatility stocks with strong primary trends using the 15-minute chart.
How to Trade Diamond Chart Patterns – Winning Strategies
Diamond Chart Pattern Definition A diamond chart formation is a rare chart pattern that looks similar to a head and shoulders pattern with a V-shaped neckline. Diamond chart reversals rarely happen...
Don’t you just love the word “best” as it applies to anything in life? Well, wait until we walk through the best day trading chart patterns, and you will see that sometimes the use of this adjective...
The Abandoned Baby Candlestick Trading Pattern: Bullish & Bearish
We have discussed a number of candlestick patterns on the Tradingsim blog. If you haven’t checked out our other resources be sure to do so, you’ll find a really nice candlestick pattern cheat sheet...


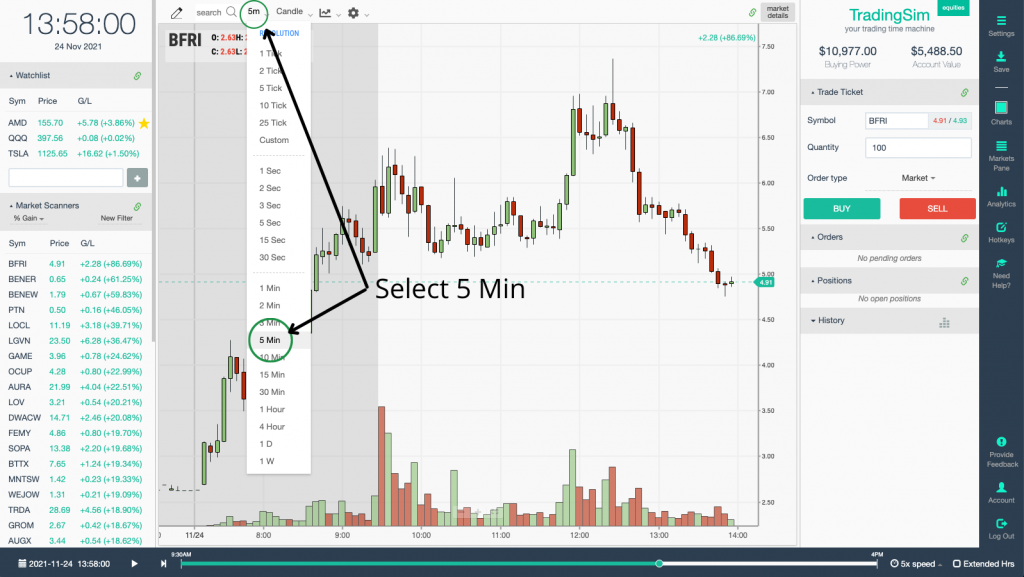
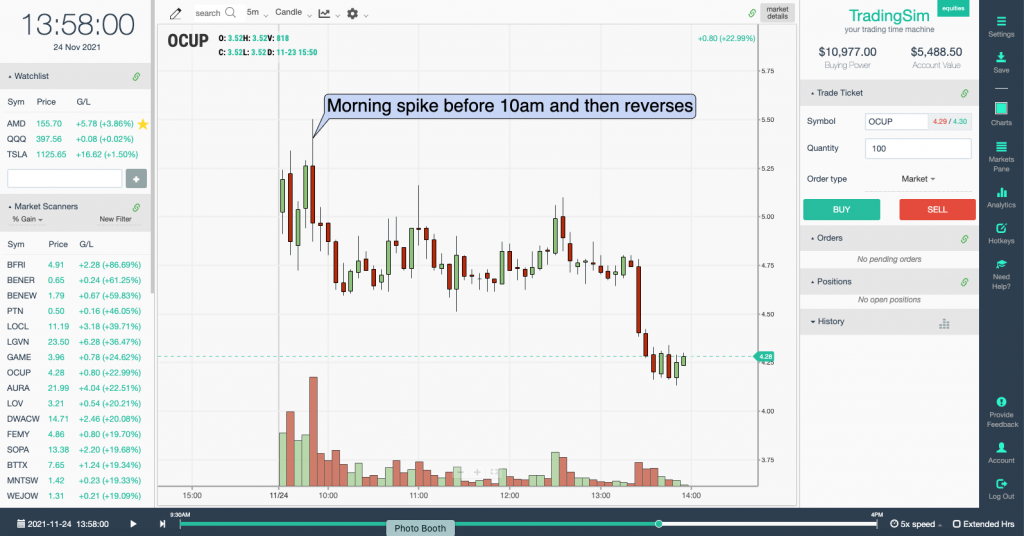
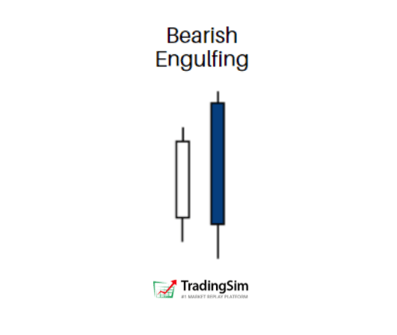
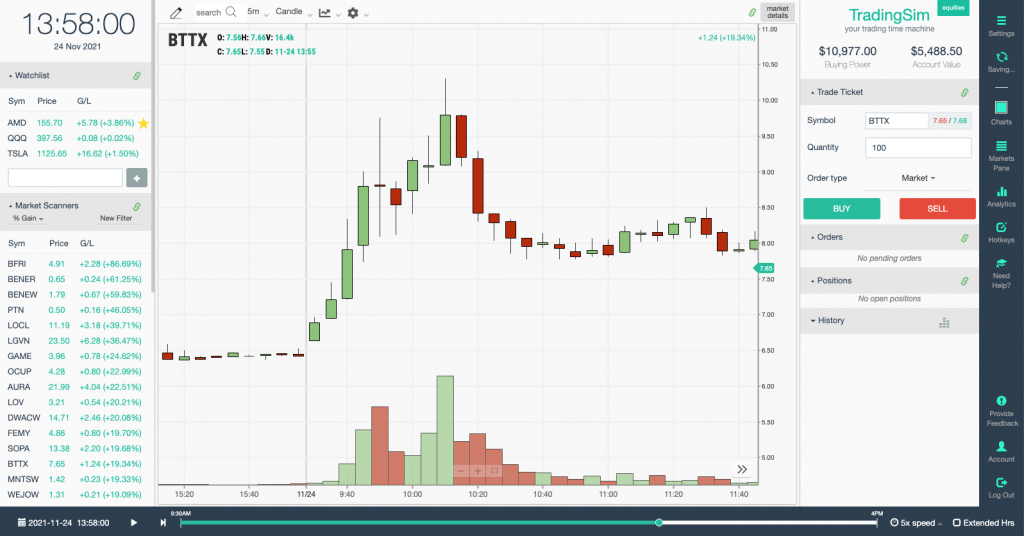

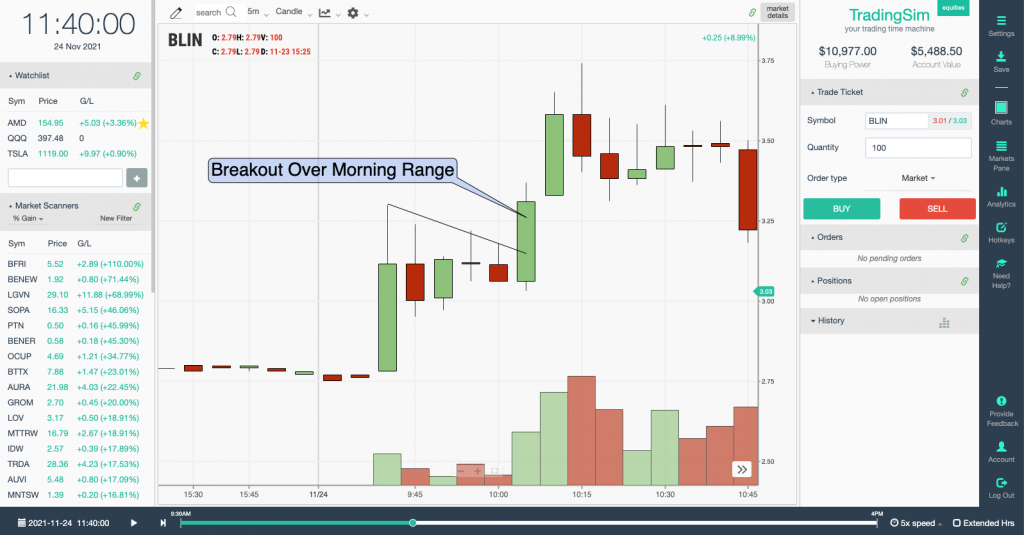
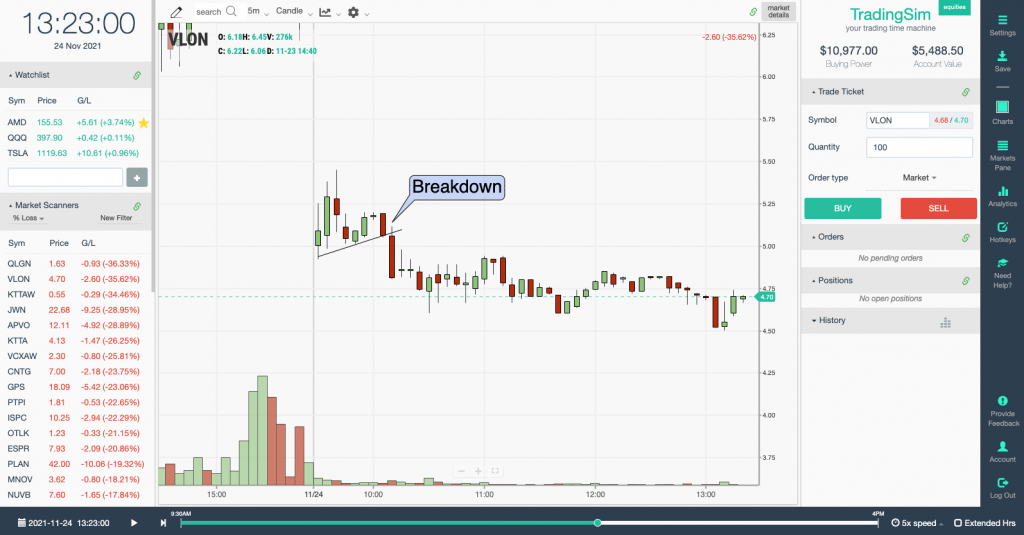
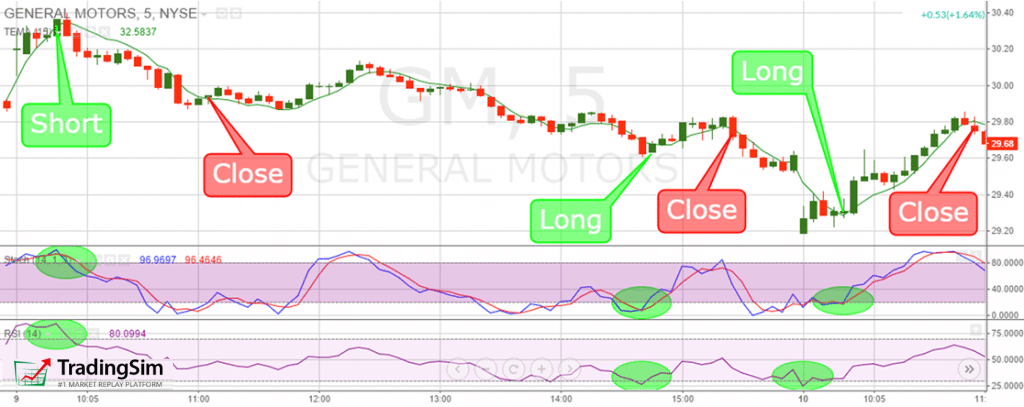

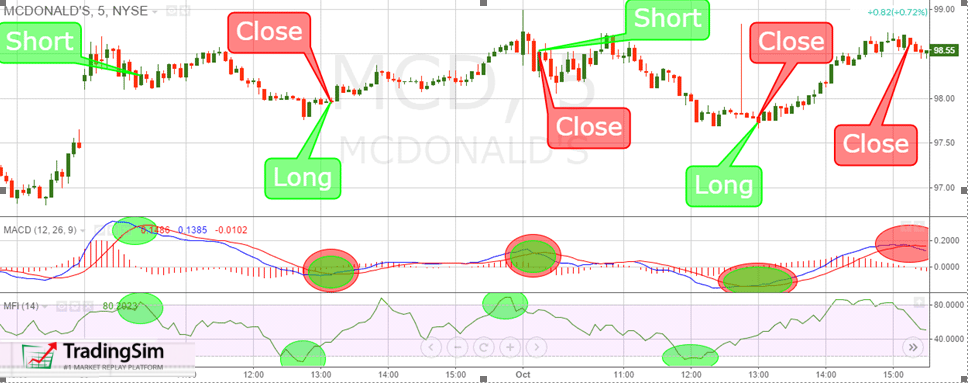
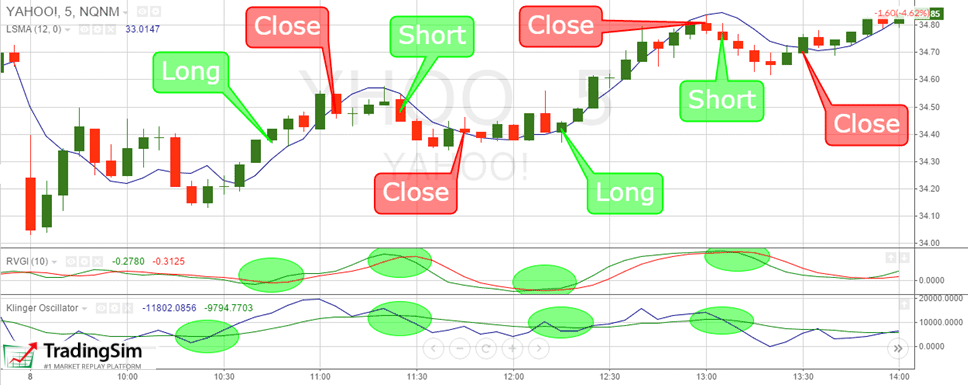

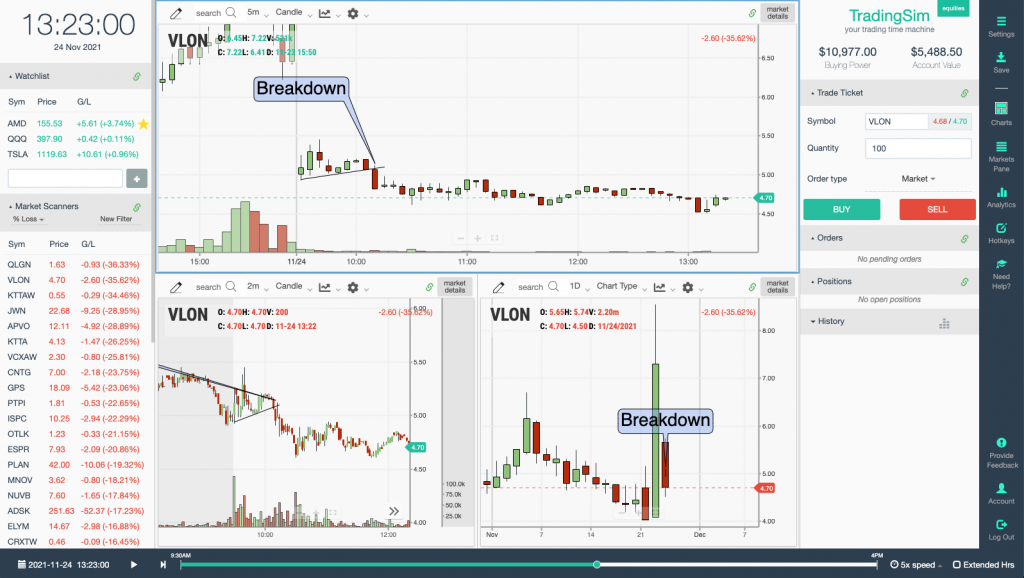


 Chart Patterns


