Our next strategy, the gap pullback buy, is one of my favorite setups. It allows us to let the morning action play out and enter into a trade with a strong setup and relatively low amounts of risk.
The gap pullback buy is predicated on the concept that the majority of the traders who chase a gap will do it on the open with market orders. The rest of the novice traders who don’t chase the open will eventually get greedy and buy in over the next few 5 minute bars, albeit, with lower volume. Once this early morning interest fizzles out, the stock will begin to fall. Obviously, not all gaps will be retraced but if this day trading opportunity presents itself, we will be prepared with a plan.
Volume is key to this strategy and it is important to note that we want to see the stock open on huge volume followed by a further advance of 1 to 3 bars on lighter volume. It is in this light volume advance where we will see the lack of leadership and the precursor to a move lower. At this point we do nothing, except for observe the volume behavior. We are not attempting to pick a top and go short.
Once the stock makes its eventual short term top, we want to see it move lower on decreasing volume and partially close the gap before putting in a strong reversal bar, a hammer candlestick would be perfect here. Traders should look for a strong pickup in volume on the reversal bar before taking a long position on the next bar. To increase the odds of a successful trade, the signal bar should close above the open of the session and stay above the close of the previous session. This will provide more indication that the stocks gap is for real. A buy stop order would be helpful here as traders can buy above the high of the reversal bar if price continues to move higher.
The presence of heavy volume and a strong reversal suggest that the big money is supporting this stock. This is exactly what we want to see as traders who are looking to follow the money.
The rules for taking this trade and stopping it out are fairly simple. A long position should only be taken when price penetrates above the high of the reversal bar. A stop loss order should immediately be placed below the low of that bar and if the range of the bar is too large, move your position size down so that you are able to trade the setup the way it was intended to be traded. One of my personal rules is to set my stop to breakeven the second I am up 1% on the position. It is absolutely unacceptable as a day trader to be up on a trade by a significant amount and end up taking a loss on it.
As far as upside is concerned, the first bigger target is the high of the day where I will sell at least half, if not all of the position. However, always stay abreast of the market condition and the other support and resistance areas on the chart. If there are significant levels of resistance on the path to the HOD, I will not think twice about selling some of my position. Remember, this game is a marathon, not a sprint. Your goal should be to take small, consistent profits from the market rather than lottery money. This is not a dreamer’s game. The worst mistake a trader can make is to get attached to targets without tying in the context of the overall market; be nimble and be ready to change at any time.
The gap pullback sell is the opposite of this pattern. It occurs after a gap down on the open followed by a retracement into that gap and a subsequent failure. You can basically turn our chart from above, upside down, to get an idea of how this day trading setup would look.
Trading Pullbacks Intraday
Since you are now familiar with the basic concepts, let’s dive into real-life examples of stock pullback trading strategy.
Gap Pullback Strategy
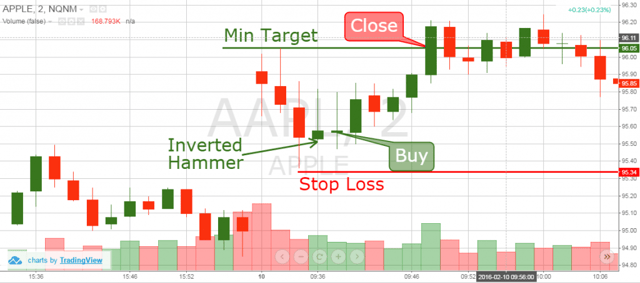
This is the 2-minute chart of Apple from Feb 10, 2016.
Apple opens with a bullish gap, with high volume that quickly reverses to the downside and retraces approximately 2/3 of the gap. After this three bar selloff, Apple prints an inverted hammer reversal signal and on the close of this candle we go long.
We use the low of the prior candle as our stop. Our profit target is located near the morning’s high – the green horizontal line on the image.
As you can see, Apple found its footing and reversed to the high of the day. The key points to call out in this trade is that we had clear entry, stops and profit targets for the trade.
Closing Portions of a Trade
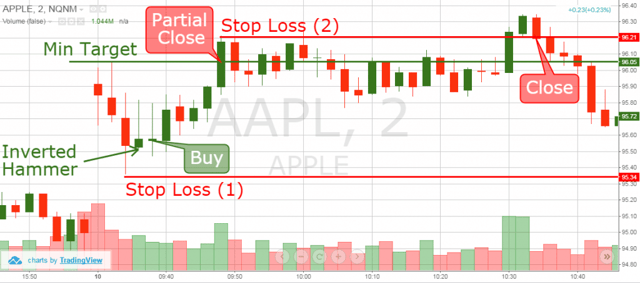
After the target is reached, we close half of the trade. Apple begins to consolidate after the initial target is reached. We hold the trade during the consolidation and we wait for the continuation of the breakout move.
Suddenly, volume begins to increase rapidly and APPL closes above the previous morning high. We immediately adjust our stop loss order above the previous high as shown on the image above. This way we lock in guaranteed profit above our first exit price.
The next candle on the chart is bearish and hits our stop. With the other half of the trade we managed to catch a further increase of $0.16 (16 cents) per share.
We made a profit of .65% on the first half and .74% on the second half of the position.
Let’s cover another trading example.
Gap Pullback Strategy – 2
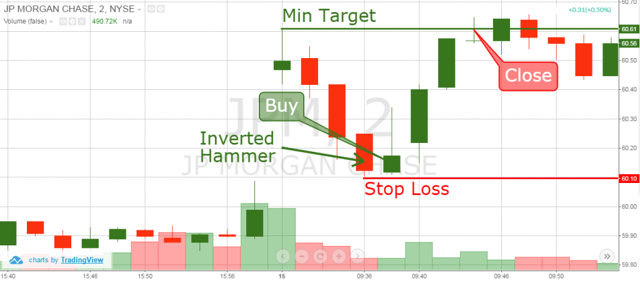
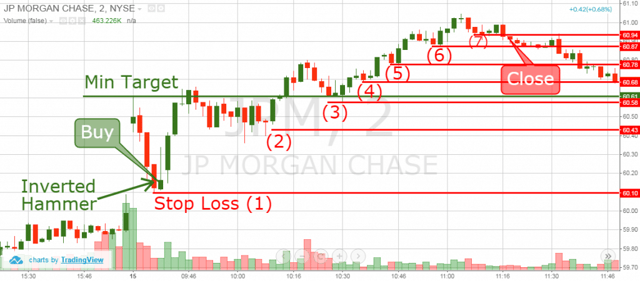
This is a 2-minute chart of JP Morgan Chase & Co. from Oct 15, 2015. The image illustrates a gap pullback very similar to the previous example of Apple.
As you continue to gain trading experience, you will notice that these patterns often repeat themselves time and time again.
First, JPM stock starts the trading day with a bullish gap on high volume. The price tops out at $60.61 and starts selling off on the very next candle. The decrease continues for three periods in a row. Then the price sets a bottom at $60.10 per share, retracing approximately 80% of the gap.
The next candle after the decrease is an inverted hammer reversal candlestick, which confirms that JPM is likely to reverse the downtrend and we enter a long position on the close of the candlestick.
The stop loss should be located below the low of the day, which is the wick of the previous candlestick.
After we enter the trade, the price begins increasing and our minimum target of the days’ high is reached. At this point, you as a trader have a choice to make. You can either: (1) close the entire trade and book your profits or (2) close a portion of the trade and hold for a higher price to sell.
Let’s assume you only sold half of the position.
Gap Pullback Strategy – VWMA
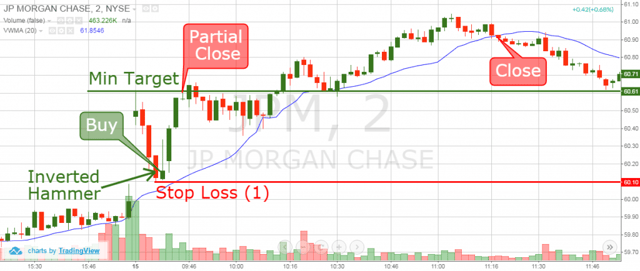
This is the same chart image, which includes the further price action of the JP Morgan and Chase stock until noon. Instead of using a tight stop in our previous Apple example after reaching our first target, we enlist the help of the 20-period volume weighted moving average (VWMA).
JPM begins a rally that takes the stock to a new high of $61.05. After JPM begins to rollover, we exit our long position once the stock closes beneath the 20-period VWMA.
On the first half of the trade we were able to capture a .75% profit and 1.26% on the second half.
Adjusting the Stop on Long Gap Pullback Trades
Another way to determine an exit signal on your long pullback trade is to manually adjust your stop loss. Every time the price has a corrective move, you should place your stop below the most recent bottom. Your stop will remain in place until a higher bottom prints on the chart, at which point you should adjust your stop accordingly.
Let’s again review the JP Morgan Chase & Co. trade using this stop approach.
Gap Pullback Strategy – Manual Stops
We have removed the 20-period volume weighted moving average and have listed the 6 times you would have updated your stops based on the price action of JPM.
Notice that we do not move our first stop before the price reaches the first target and sets a higher low. Once a new high is reached, we then adjust our stops accordingly based on the swing lows printed on the chart.
In this case, we close approximately at the same price as the VWMA indicator at stop #7. However, in most cases, manually adjusting stops will get you out a bit earlier.
This has positive and negative implications.
The image below will show you the difference between the two.
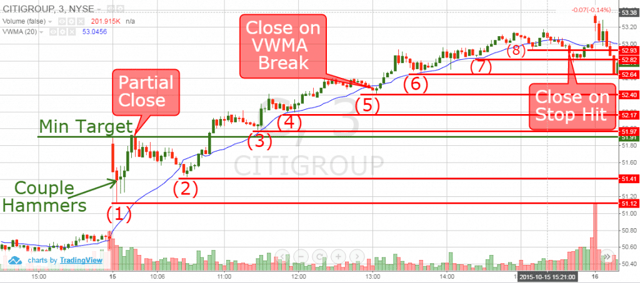
Gap Pullback Strategy – Manual Stops versus VWMA
Above you see the 3-minute chart of Citigroup from Oct 15, 2015. On the chart we have the 20-period VWMA and stop loss levels based on each swing low.
The trading day starts with a bullish gap with high volume. During the next few periods, the volumes are still big, but they are decreasing. Two periods after the market opens, Citigroup decreases sharply, filling approximately 70% of the morning gap.
Citigroup then creates a bottom with two hammer reversal candles and we get long. The minimum target of the trade should be located at the high of the gap as shown on the image above. Your initial stop loss order should be located below the low of the day.
Once the first target is reached, let’s now follow the manual stop loss orders and the 20-period VWMA to identify the exit signals generated by each approach.
After the price reaches the minimum target, we see a decrease which breaks the 20-period VWMA. However, we disregard this signal because the price has not switched above the minimum target and we rely on our initial stop loss order. Citigroup price increases afterwards and breaks the minimum target.
When this happens, we adjust our stop loss below the previous bottom at position (2) and activate our 20-period VWMA stop as well.
As Citigroup climbs the proverbial wall of worry, we update our manual stops below each swing low and below the 20-period VWMA.
After we place the stop loss order at #4, the price increases initially; however, the correction breaches the 20-period VWMA near manual stop #5.
If we rely on the volume weighted moving average for closing our gap pullback buy trades, we would exit the trade as this point.
On the flip side, if you were using swing lows as your stops, stop #4 was not breached and you would have stayed in the trade. To take it a step further, based on the manual stop loss strategy, we would have closed the trade out at 52.93 when the price hits the adjusted stop loss #8.
Summary of the VWMA versus Manual Stops Approach
Based on the 20-period VWMA, the profit from the second part of the trade equaled 1.92%.
Conversely, on the manual stop loss order strategy, the profit from the second part of the trade was 2.96%.
Please do not interpret this to mean a manual stop always outperforms an indicator. You have to know when to use the right approach, or keep things simple and stick with one.
A good rule of thumb is that if the price moves dramatically higher, using a swing low may require you to give back a lot of your profits if the stock rolls over. On the other hand, if a stock is slowly stair stepping higher, a moving average will likely stop you out based on a low volume test of support levels.
Conclusion
-
The gap pullback occurs when novice traders are misled by a gap in the morning.
-
The gap pullback is a great morning strategy as it reduces your risk as you are not buying at the highs of the day.
-
At the end of the pullback, we need a reversal candle in order to enter a trade.
-
Properly interpreting volume is a crucial ingredient when trading gap pullbacks.
-
Your initial stop loss should be located below the lowest wick of the pullback’s bottom (low of the day).
-
When the minimum target is reached, you can close the whole trade or part of it.
You can use either manual stops or a moving average to manage the winning position.


 Awesome Day Trading Strategies


