Open the individual trade
Move from reviewing your performance across sessions to the entry and exit of a specific trade.



Build your workspace, analyze a setup, manage simulated trades, and replay the decisions that matter.
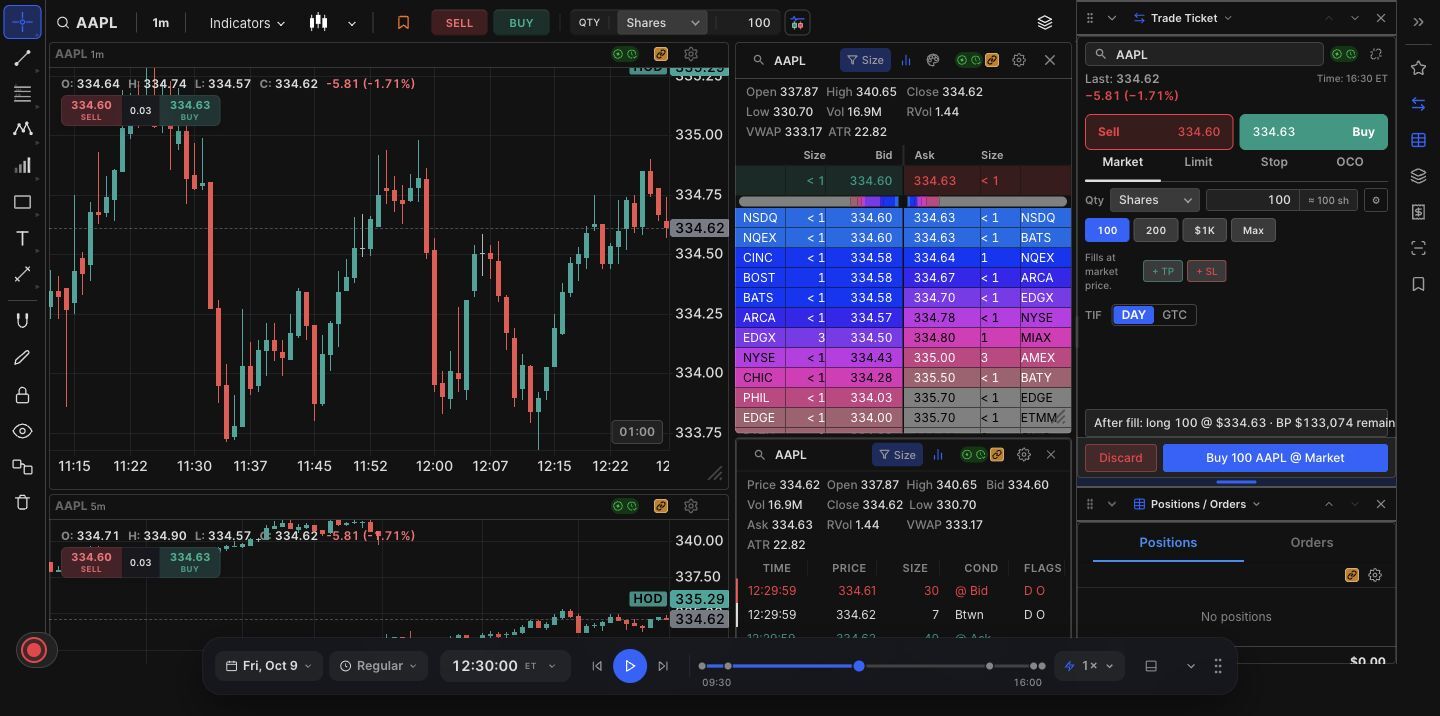
Chart trading · Custom workspaces · Trade analytics & replay
See the tools you can put to work in your next session: chart orders, daily Pivot Points, Ichimoku+, hotkeys, and more. Select a feature to take a closer look.
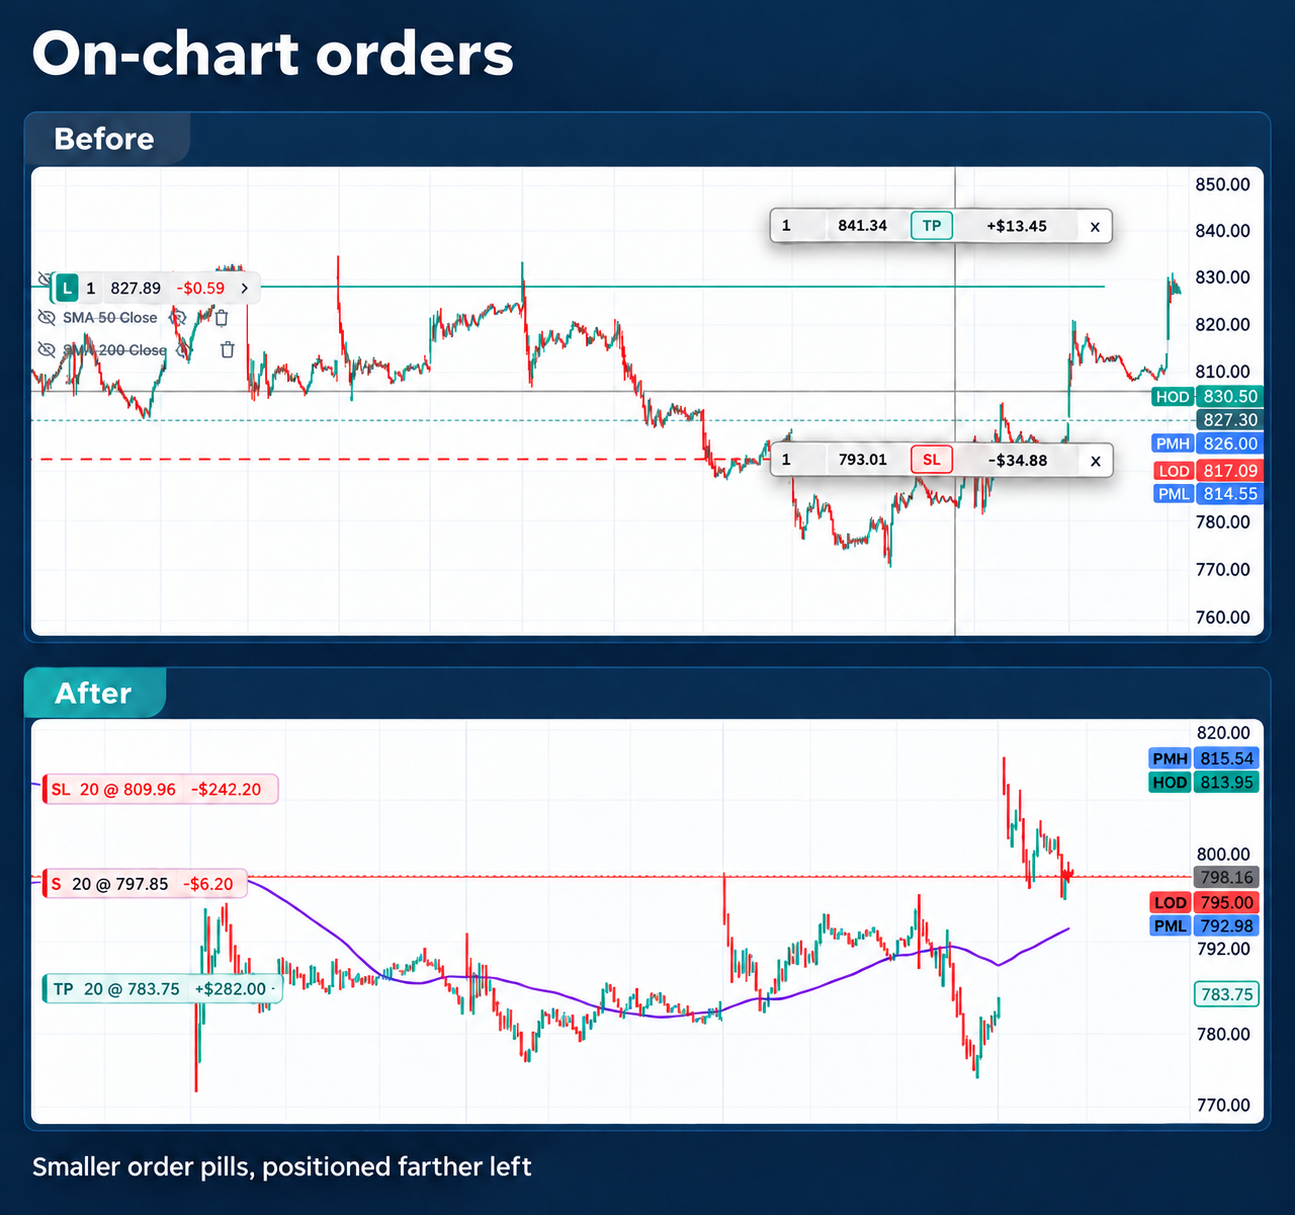
Compact on-chart order pills keep the candles visible. Edit price and quantity, move a price-axis tag, and confirm a working-order change with a check mark or Enter.
Trade analytics
Open a historical trade and examine the details of your entry and exit. Replay the price action around each execution to see what you want to repeat and what needs more practice.
An early entry, a rushed exit, a level you overlooked: review the trade in context while the decision is still worth studying.
Delux brings historical trade review and a full replay chart together. Keep your indicators and drawings available as you examine the setup, then use Replay Rail to jump to an execution.
Start Reviewing Your TradesOpen the historical trade and revisit its entry on the replay chart. Examine the nearby candles and the levels you were watching.
Did you enter at your planned level, or chase the move?
Use these review questions to choose the focus of your next practice session.
Move from reviewing your performance across sessions to the entry and exit of a specific trade.
Use Replay Rail to return to a trade’s execution and study the market at that moment.
Review with the full chart, indicators, and drawing tools. Revisit your levels as the surrounding price action unfolds.
Historical market replay gives you time to work through a setup, pause at a decision, and return for another attempt.
Pause the session to inspect a level or change the playback speed as prices unfold. Use another session to practice applying the same rules to a different day.
Dock the replay bar at the bottom, float it where you need it, or collapse it to give the chart more room. Delux remembers its placement.
Bookmark a setup, an entry, or an exit you want to examine again. Cycle through important moments without searching through the entire session.
Arrange the tools you use, connect related charts, and save a workspace you can return to.
Reorder and resize panels for scanning, execution, or review. Save the arrangement and switch between named workspaces across devices.
Link symbol changes across charts. Use a time-linked crosshair to examine the same moment in different views, and synchronize drawings across charts of the same symbol.
Enter a custom timeframe such as 7 minutes, 45 seconds, 233 ticks, or 3 days. Pin favorite intervals and start typing on a chart to search for a symbol.
Keep the watchlist, scanner, Trade Ticket, Positions, Level 2, Time & Sales, and Bookmarks close to your charts. Adjust their placement for the work at hand.
Data history, tick and second charts, and Level 2 access depend on your plan.
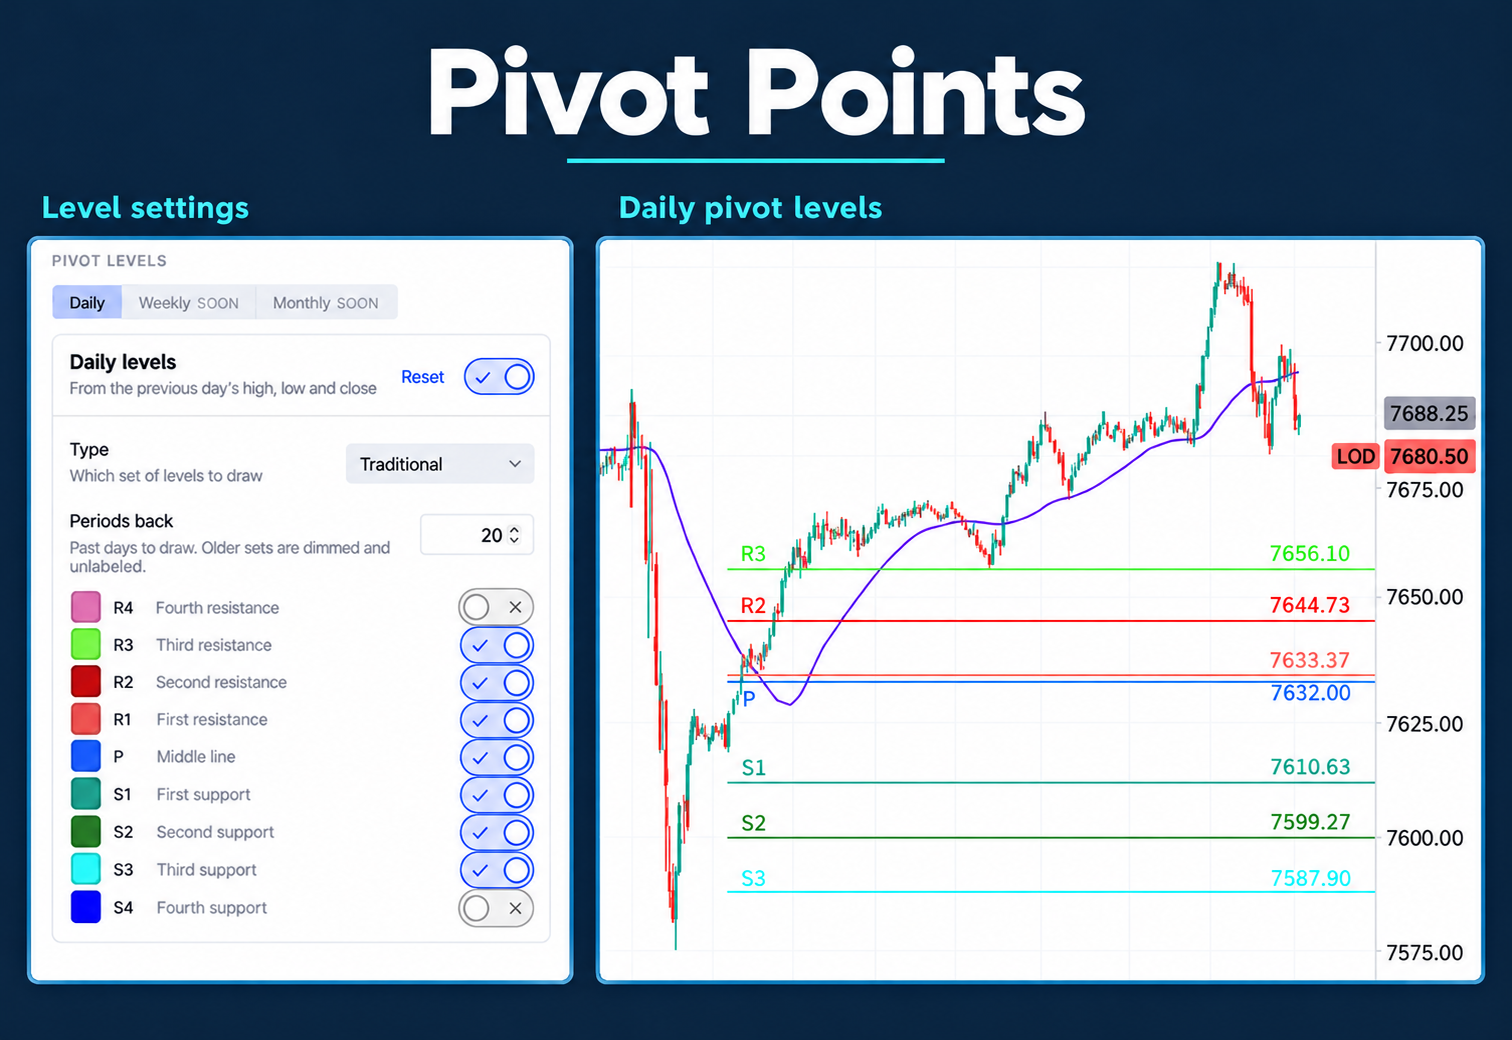
Add reference levels to your chart using Traditional, Fibonacci, Classic, or Camarilla daily pivots. Choose how many past sessions appear, then customize each level’s color and visibility.
Select Traditional daily pivots in Delux. Choose the sessions shown and customize the color and visibility of individual levels.
Daily pivots are available in this release.
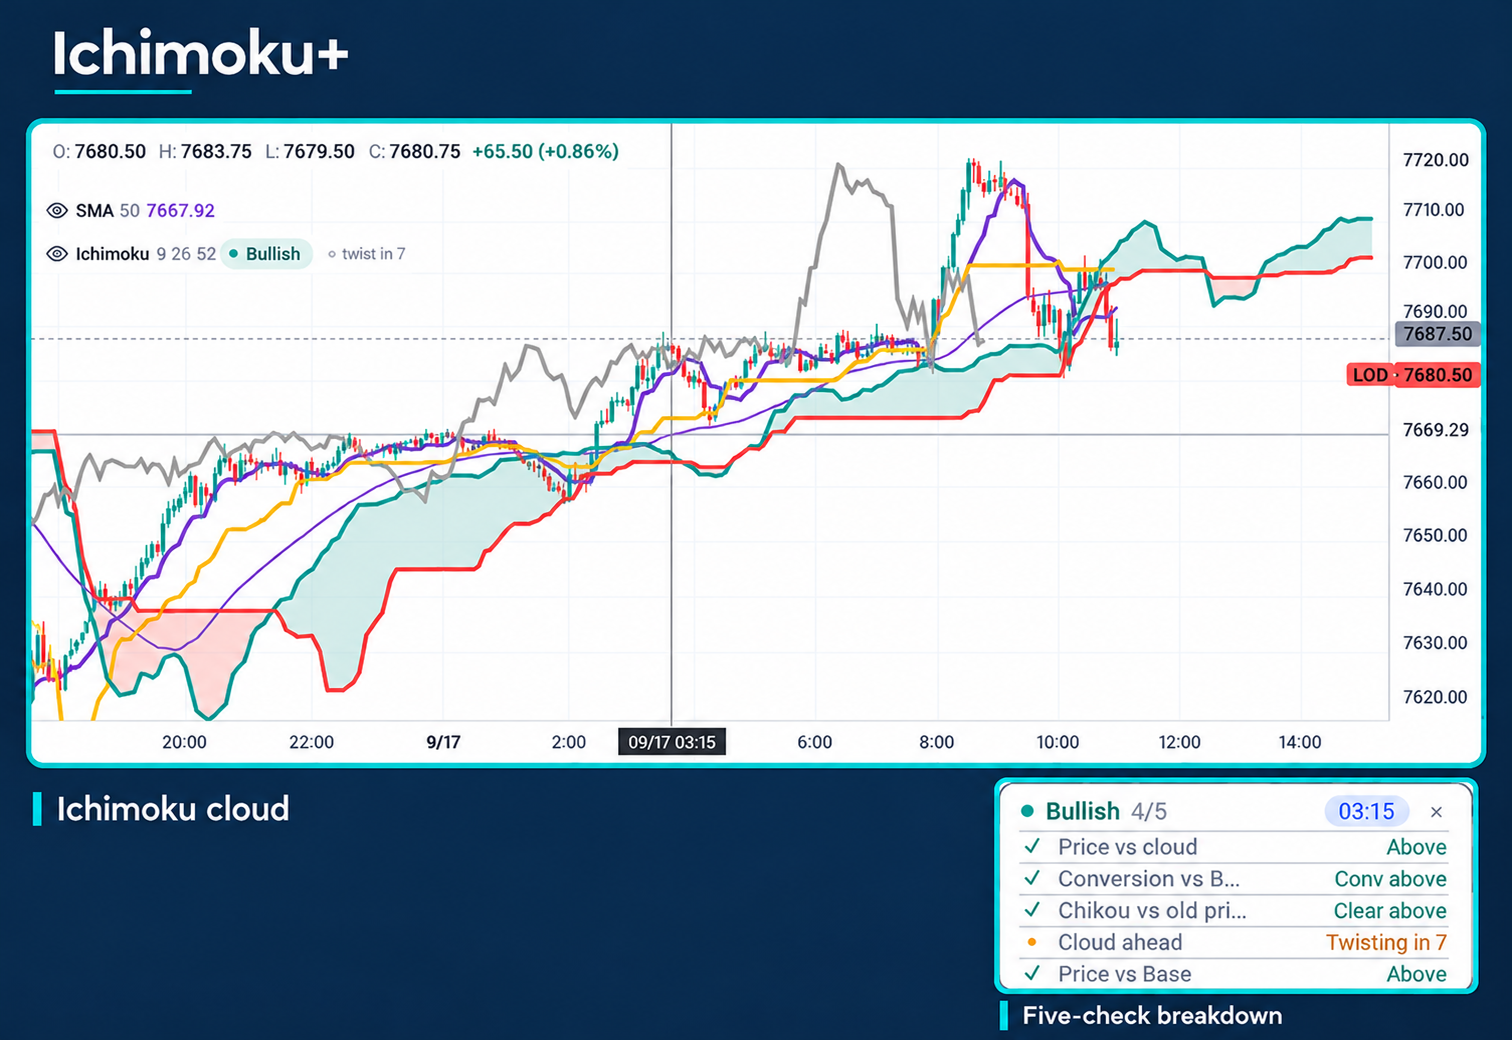
Move the crosshair over a bar to see a Bullish, Bearish, Mixed, or Wait verdict. Open the verdict to inspect the five checks behind it, then open a check for a plain-English explanation.
Choose Just the Cloud for a simpler Ichimoku chart view. Standard and Full display presets are also available in Delux.
The settings also include period presets and a comparison alignment helper, so you can configure the indicator for your analysis.
Use indicator conditions alongside your own entry and risk rules.
Mark a level, measure a move, and keep your analysis available when you switch views or review a trade.
Use Fixed Range Volume Profile with point of control and value areas. Add anchored VWAP from a selected starting point, and style reference levels for the current day, previous day, premarket, and session open.
Work with Fibonacci per-level styling, XABCD and Elliott Wave tools, shapes, text, and live measurements. Rectangles and the Info Line show dollar and percentage moves.
Save a full chart template or apply selected settings. Carry drawings, annotations, and their styling across charts of the same symbol, including Trade Replay.
The long and short Position Tools help you sketch a trade and examine its risk and reward.
Set an entry, stop, and target on your chart using the long or short Position Tool.
Read the planned R multiple and expected-value information while adjusting the setup.
Use the plan to guide your simulated entry, position management, and review.
This is a description of the planning workflow. Expected-value information helps you examine assumptions; it does not predict a future trade.
Use the on-chart BUY and SELL controls or the chart’s context menu. Draft an entry with take-profit and stop-loss levels, then keep the order close to the price you are watching.
Working-order changes require confirmation by default. Compact order pills leave more of the candles visible; price lines appear on hover unless enabled across the chart.
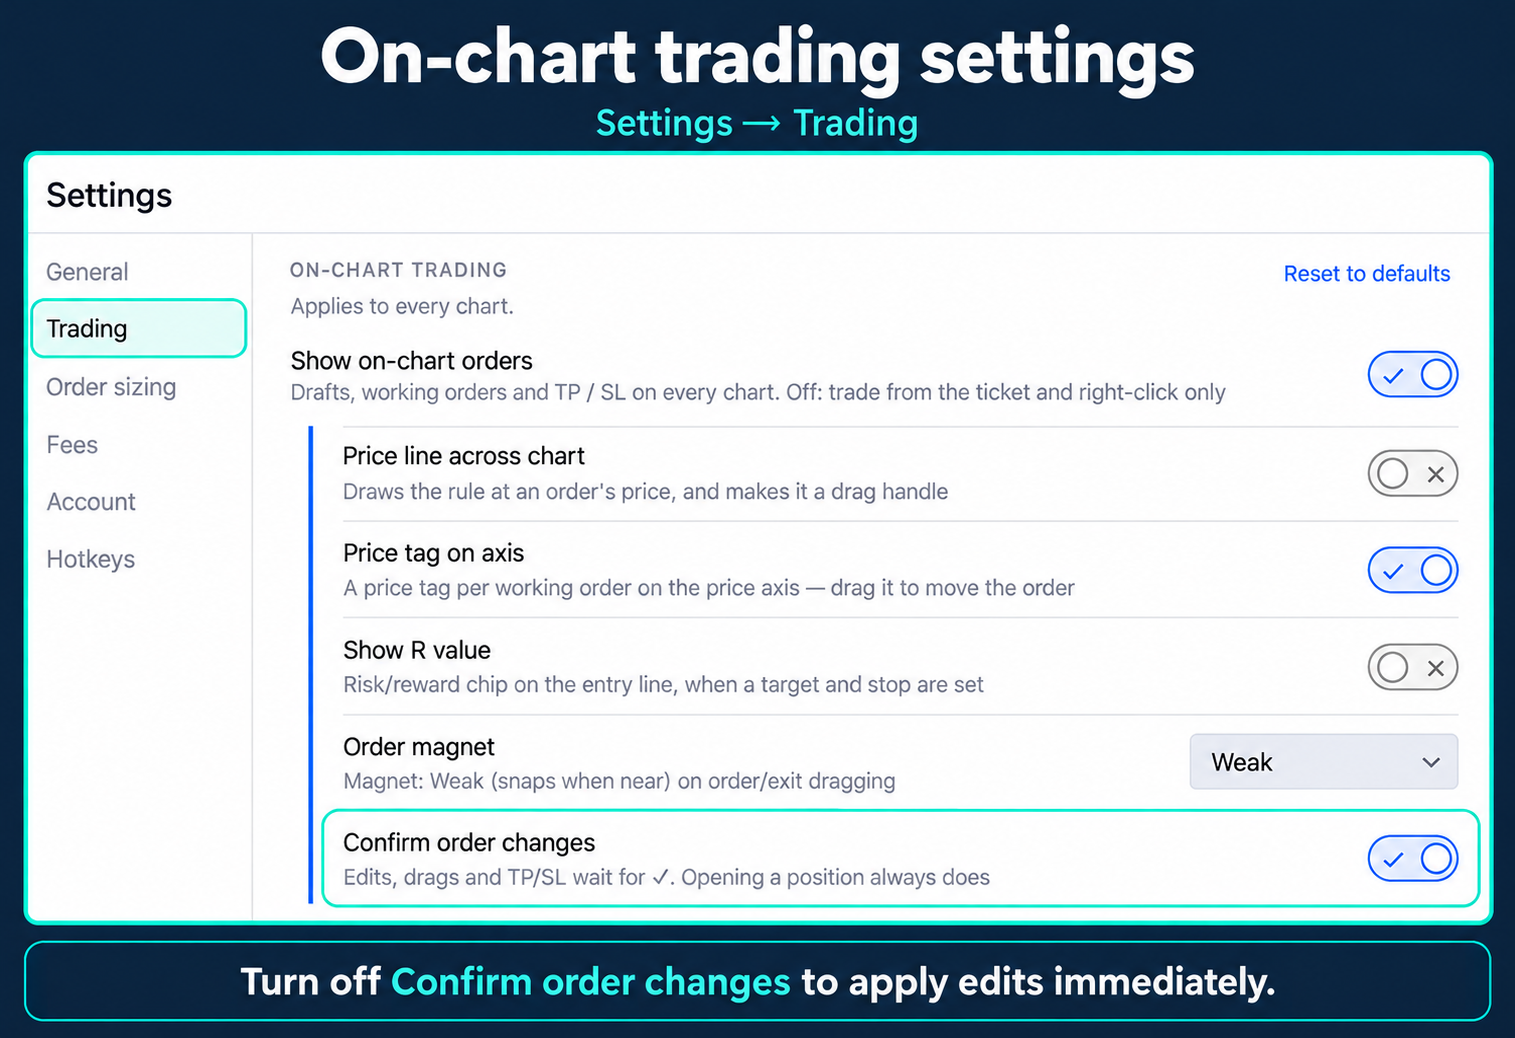
Choose which order details stay visible while you practice. Keep price tags on the axis, display an R value when your target and stop are set, and choose how Order Magnet behaves.
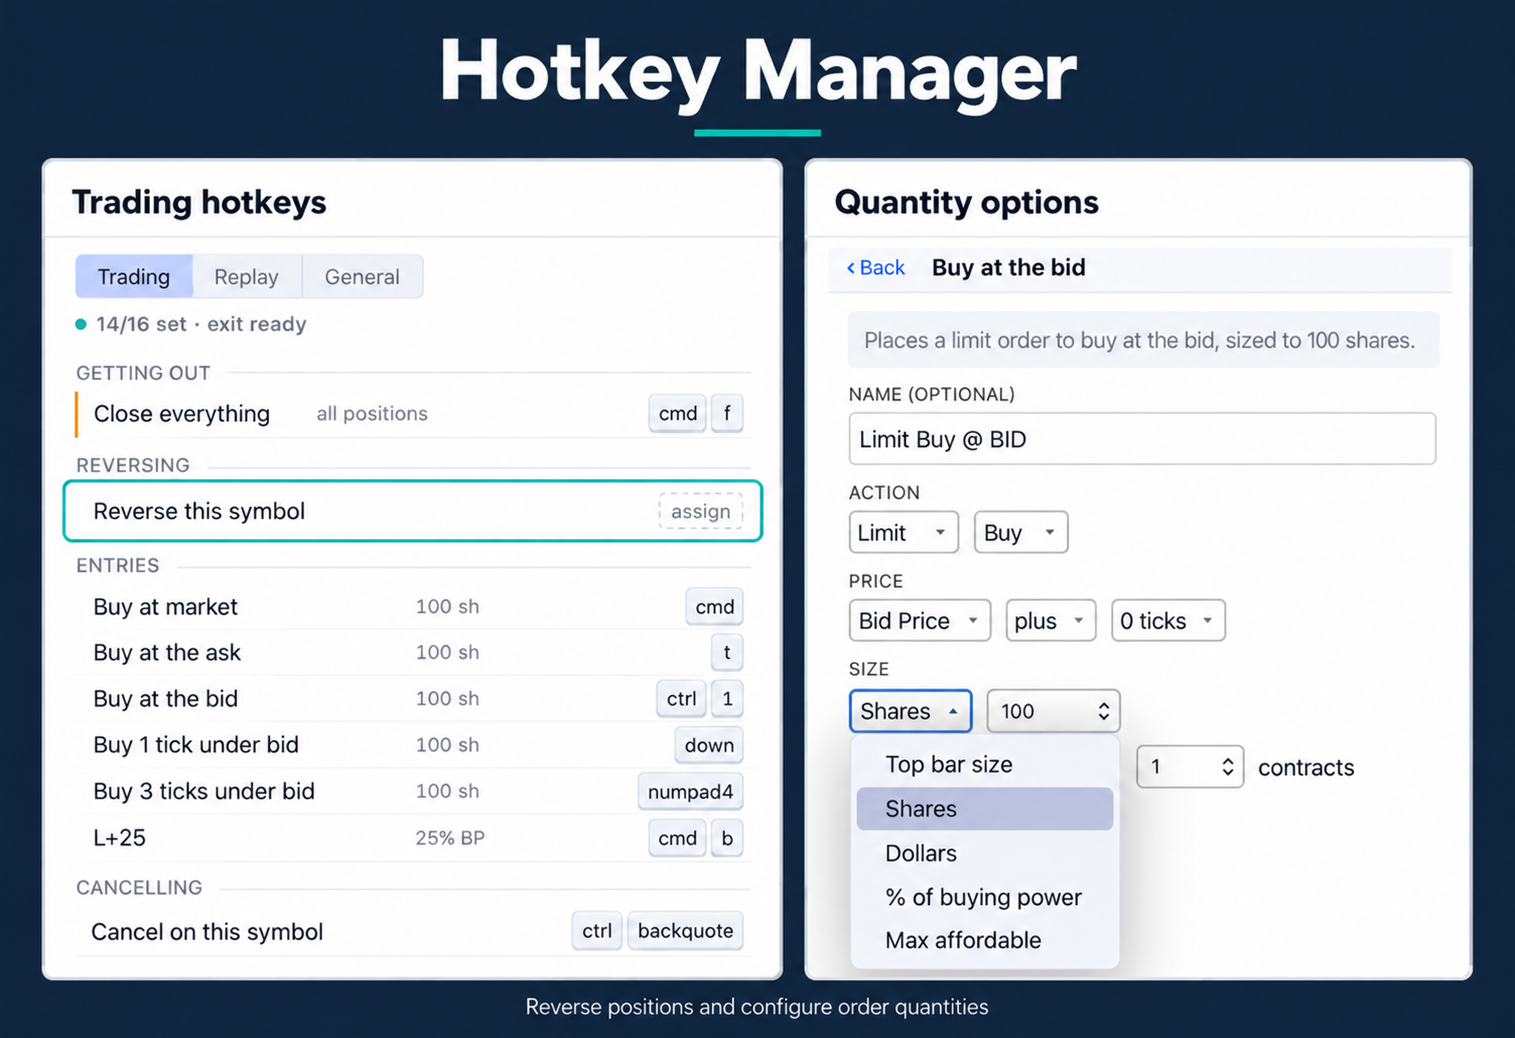
The rebuilt Hotkey Manager puts your repeatable actions in one place, including a shortcut to reverse a position.
Set equity and futures quantities separately for each hotkey. Choose from the supported sizing modes, including a dollar amount, a percentage of buying power, maximum position, or the quantity in the top bar.
For futures, Delux uses contract margin, tick sizing, and contract-based profit and loss.
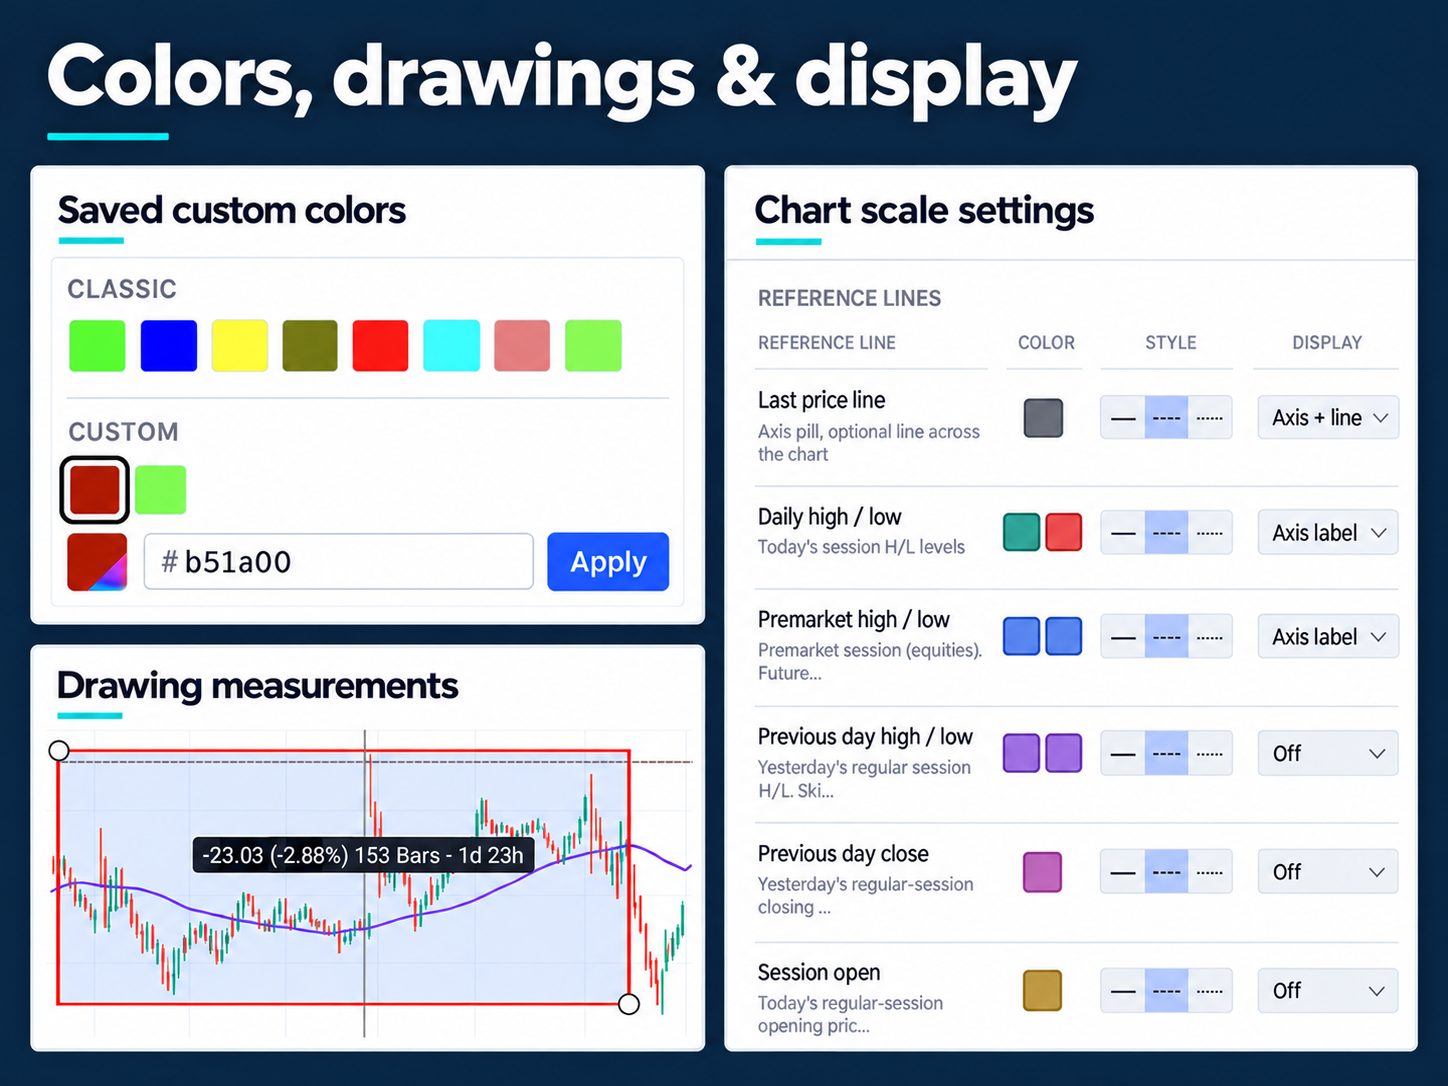
Save a custom hex color and reuse it across charts, drawings, indicators, Level 2, and Time & Sales. Adjust text size and choose Compact, Cozy, or Comfortable density for the panels you use.
Set colors and styles for reference levels, double-click the price axis to fit the visible bars, and resize the divider between price and indicator panes.
Find the tools that fit your practice. Search by name or choose part of the workflow.
40 features
Replay sessions, pause the action, and control playback.
Jump to individual executions across the session.
Review with indicators and drawing tools available.
Mark session moments and return to them.
Dock, float, or collapse the replay controls.
Record and export clips for later review.
Choose second, minute, tick, or day intervals and save favorites.
Choose Traditional, Fibonacci, Classic, or Camarilla.
Inspect a verdict and open its five underlying checks.
Carry drawings across same-symbol charts and Trade Replay.
Study point of control and value areas within a range.
Add VWAP from a selected starting point.
Control the appearance of individual Fibonacci levels.
Mark patterns with dedicated drawing tools.
Read dollar and percentage moves on rectangles and the Info Line.
Style daily, premarket, previous-day, and session-open levels.
Use automatic candlestick pattern recognition on charts.
Apply full or partial templates to reuse chart settings.
Draft orders directly from the chart.
Plan protective exits with draft entry orders.
Map long or short trades with R multiples and expected-value information.
Edit price and quantity or drag price-axis order tags.
Snap toward nearby bar highs, lows, or the last price.
Review working-order changes before applying them by default.
Convert a resting limit or stop order with the →MKT control.
Configure a shortcut to reverse the current position.
Set equity and futures quantities separately using available size modes.
Practice with contract margin, tick sizing, and contract-based P&L.
Preserve sub-dollar and fractional-tick price precision.
Save arrangements and use them across devices.
Connect symbol changes and compare moments with a linked crosshair.
Keep a selection of symbols and scanning tools near the chart.
Use configurable palettes and display settings; access varies by plan.
Reorder and resize panels to suit the session.
Reuse applied hex colors across supported app settings.
Choose Compact, Cozy, or Comfortable across key panels.
Start typing in a chart to find a symbol.
Drill into a historical trade and examine its entry and exit.
Review your practice, then open the trade you want to study.
Use Replay Rail to jump to an execution and inspect the surrounding price action.
No matching features. Try a different search or choose All.
Choose the data history and feature access that fit your practice. Availability varies by plan.
TradingSim Delux is the newest TSIM platform release, built around hundreds of feedback points from the trading community. You get more control over your charts and order entry, workspaces you can save, and the ability to drill into a trade and replay your decisions. It brings preparation, simulated execution, and review into one practice session.
Choose a historical session, work through your setup, and review the trades you took. Pause to examine a decision, change the replay speed, and return to a moment you want to study. You can focus your next session on the entry, exit, or execution habit you want to improve, using simulated capital.
Yes. Open a historical trade to examine its entry and exit, then replay the surrounding price action. Use Replay Rail to jump to an execution and keep indicators and drawings available on the full chart. That gives you a concrete way to study an early entry, a rushed exit, or a decision you want to repeat.
Yes. Save named workspaces for scanning, execution, or review, and return to those layouts across devices. Reuse chart settings with full or partial templates and synchronize drawings across charts of the same symbol. Spend your practice time studying trades instead of rebuilding your setup.
Use daily Pivot Points to bring reference levels into view, or open an Ichimoku+ verdict to inspect the five checks behind it. Custom timeframes, anchored VWAP, and drawing tools give you more ways to examine the price action. Practice using that analysis with your own entry and risk rules.
Choose the plan with the market data and chart detail your routine needs. Data history, tick and second charts, and Level 2 access vary by plan. Compare the current options, then start a trial to work through a session with the tools you expect to use. Compare plans →
Start your free trial and take a setup through the full process: prepare your chart, place a simulated trade, then open it for review. Try saving your workspace and configuring the shortcuts you use most, so you can judge how Delux fits your routine. Start your free trial →
Choose a session, bring your trading rules, and give your next setup a place to practice.
Start Your Free TrialBack to the Homepage