Ulcer Index – How to Forecast Shorts and Filter Volatile Trades
May 24, 2019
Written by: Al Hill
The Ulcer Index measures the amount of risk on a trade. Hence the name ulcer for the pain and stress these moves can inflict on the less skilled trader.
In this article, we will test the indicator to see how well it can forecast extremes in the market.
How to Calculate the Ulcer Index
The index is all about calculating the level of risk by looking at how far a stock has fallen from recent highs.
The calculation of the ulcer index is a three-step process [1].
Step 1
Drawdown Percentage = ((Close – Highest Close over 14-periods)/Highest Close over 14-periods)
Step 2
Squared Average = (14-period Sum of Percentage Drawdown Squared)/14
Step 3
Ulcer Index = Square Root of Squared Average
What Does the Ulcer Index Tell Us?
Ulcer Index
The index is a way for you to quickly size-up the level of volatility in a trade at a glance. There are two things that I see slightly differently than the other articles on the internet.
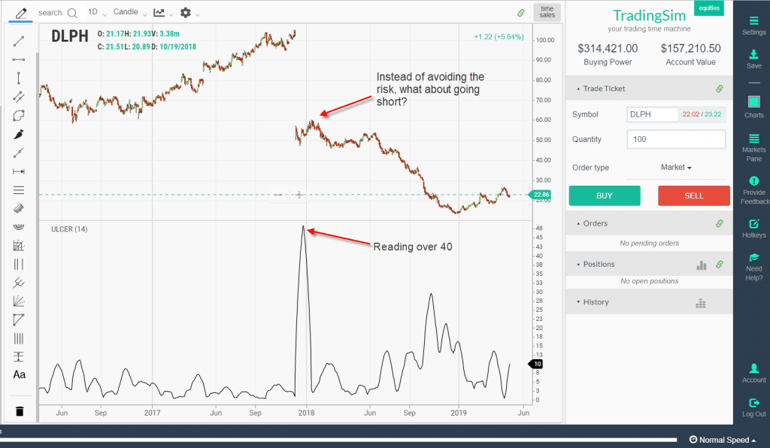
#1 – High Readings = Time to Get Short
There are several blog posts which state that a high reading shows an increased level of risk and should be avoided. I 100% agree with that statement, except why avoid the stock completely?
Why not go with the trend and get short?
For example, it’s clear that once you see readings above 40, a stock is in real trouble.
Now, this doesn’t mean you should get short right away on a high reading, but rather wait for the stock to rally on light volume and then open a trade.
Since you are short, the high reading means it’s actually a low-risk opportunity for you versus if you were long.
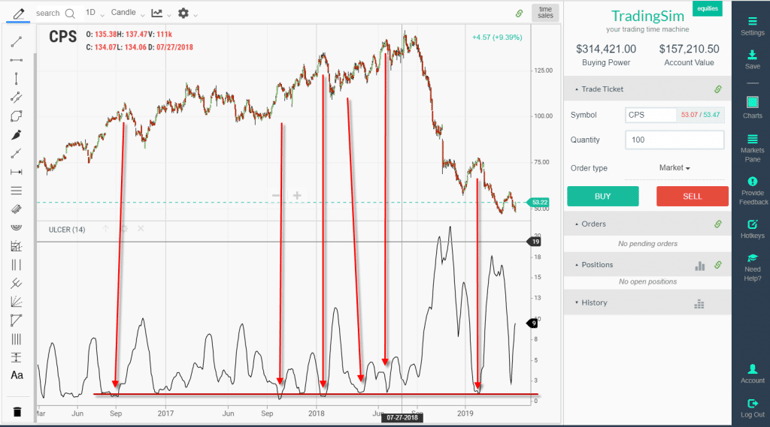
#2 – Low Readings Another Short Opportunity
Low Readings Are Short Opportunities
In the above chart, do you see how the low readings present short opportunities?
Again, you can’t go out there and just start shorting on every low reading, you will need more confluence from chart patterns and other technical indicators.
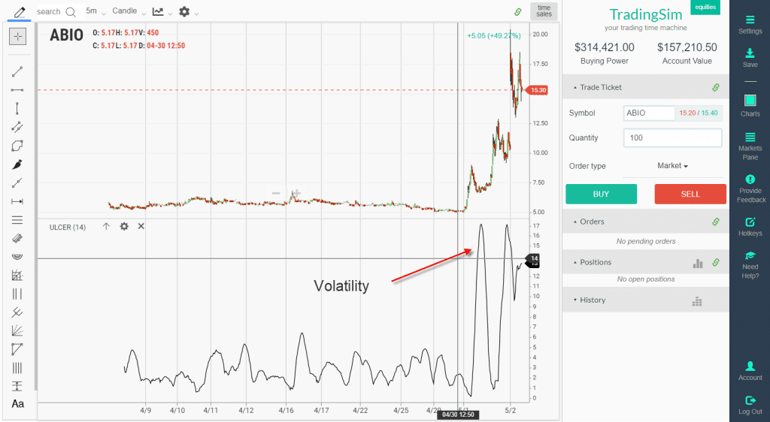
Does the Ulcer Index Indicator Work Intraday?
The indicator works just as well on an intraday basis as it does on daily and weekly bars.
Below is a chart of the stock ABID. Notice how the indicator tracks the volatility of the stock with the same level of accuracy as the longer timeframe charts mentioned above.
Intraday Price Chart
My Issue with the Indicator
Lagging Indicator
While the indicator will provide an indication of increased price volatility, it is quite delayed.
The reason the above charts appear to nail each top is that there is a 14-day lookback period. When you are trading the stocks in real-time it will be very difficult to use the indicator for any forecast purposes.
Too Much Subjectivity
Now don’t get me wrong. Any indicator or trading method will require some level of analysis. There simply is no way around it.
However, the ulcer index indicator on one chart can mean an entirely different thing on another. For this reason, I feel the level of mastery required to gain a firm grip on the indicator places too much of a burden when analyzing stocks.
Where the Indicator Works
Where I can see value in the indicator is in simply gauging the volatility of a stock and sizing up broad market behavior.
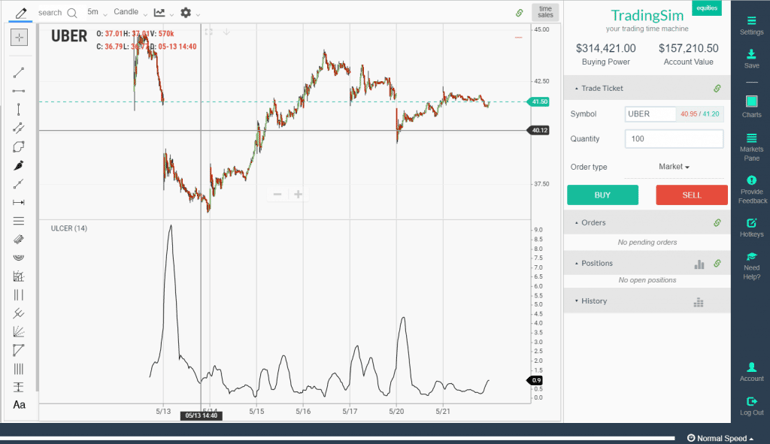
Using the Ulcer Index as a Volatility Filter
The indicator can do one thing and one thing really well. It can provide you with an excellent volatility indicator and how much a stock has retraced from recent highs [2].
For me, I do not trade penny stocks or stocks with high volatility.
Why you may ask?
Because honoring my stops is one of my biggest weaknesses. Therefore, trading low volatility stocks prevent me from placing blow up trades.
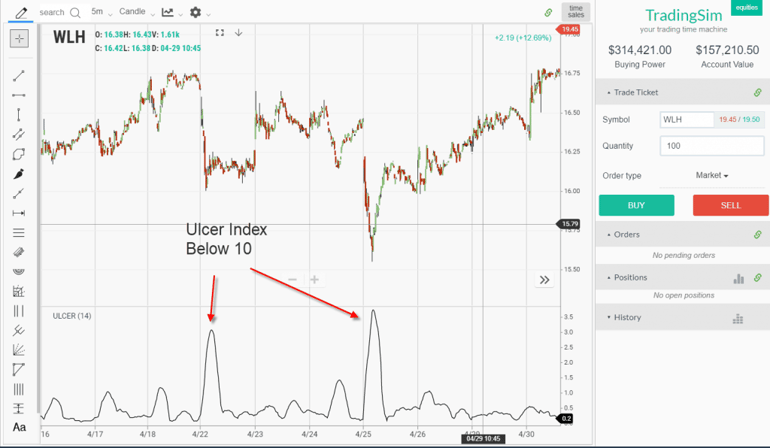
So, a simple filtering method is to set a maximum amount of the ulcer index indicator that you will trade. For example, if the stock has an ulcer index indicator value of 10 or more you will not place any trades.
Ulcer Index Below 10
This way you are not taking any long positions in a stock that has the potential of causing you real pain.
Assessing The Market
Another way to leverage the indicator is to assess the broad market.
Whether you are a day trader or long-term investor, it’s a good idea to have some indication of what the market is up to.
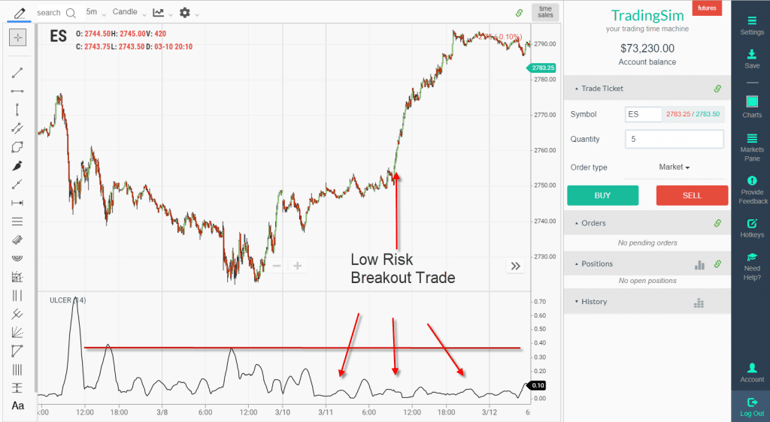
Low-Risk Breakout
Above is a 5-minute chart of the S&P 500 E-mini.
The point I am illustrating above is that you can also use the ulcer index indicator to gauge the level of risk prior to a breakout.
Please note this does not mean the breakout will work, but it lets you know there is a lower level of risk prior to entering the trade.
If you do not trade futures, it’s also just good to know the market is moving higher with lower risk.
Why is the risk lower?
Well as you can see before the breakout, the market was flat before showing a sign of strength. This works in your favor because you can now place a tight stop below the recent congestion.
How Can TradingSim Help?
TradingSim has the ulcer index indicator in our library of technical indicators. From what I can see, the indicator requires further analysis for you to build a system.
Rules such as thresholds for filtering and specific rules for going long and short.
Absolute Breadth Index – See How to Identify Trading Opportunities
Absolute Breadth Index Overview The Absolute Breadth Index or ABI measures market volatility. Unlike other technical tools, the ABI does not forecast market direction. Hence the indicator is also...
Overview of Elder’s Force Index (EFI) You can never call Alexander Elder a humble guy as he decided that the best name for his indicator would be that of his own last name. I can however appreciate...
What was Bill Williams [1] thinking when he came up with the name awesome oscillator? With names floating around as complex and diverse as moving average convergence divergence and slow stochastics,...


 Breadth Indicators


