price, risk, swing high and swing low, technical analysis, trading strategy, support and resistance, trader, moving average, day trading, candle, chart, option, order, swing trading, momentum, risk management, asset, fractal, bollinger bands, pullback, candlestick, demand, trough, market sentiment, relative strength index, cryptocurrency, chart pattern, candlestick pattern, volatility, doji, probability, currency, technical indicator, financial instrument, price action trading, triangle, behavior, candlestick chart, understanding, wedge, concept, market analysis, point and figure chart, odds, low trading, swing low trading, turning points, market trend, macd, profit, strategy, stock trader, leverage, currency pair, fundamental analysis, stochastic oscillator, fibonacci retracement, head and shoulders, pattern, ratio, moving average crossover, stochastic, broker, supply and demand, investopedia, understanding market, trade ideas, swing traders
How can traders identify potential entry and exit points in the market?
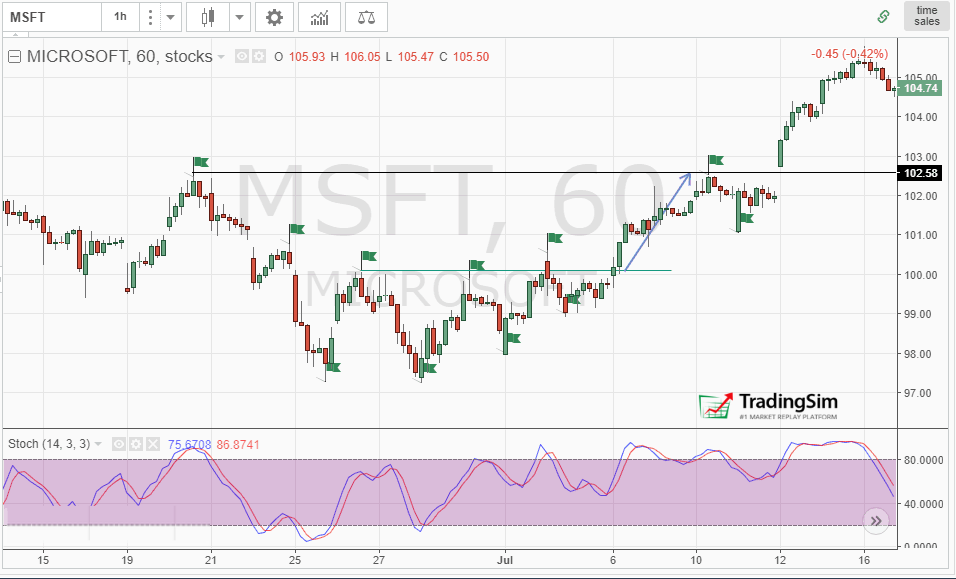
Traders can identify potential entry and exit points by observing swing high and swing low points on the chart. These represent points where the trend may reverse or continue. Identifying these levels can help time entries and exits with the trend.
What strategies can be used to detect significant reversals in market trends?
Swing high and swing low analysis can be used to identify significant reversals in market trends. By tracking the formation of higher highs, higher lows, lower highs, and lower lows, traders can pinpoint potential trend reversals. Monitoring support and resistance levels that coincide with swing points also provides insights into changing market dynamics.
Can technical analysis help in predicting the next market movement?
Technical analysis can help identify trends, support/resistance levels, and patterns that may indicate future market movements. However, it should be used alongside other analysis methods, as market movements are ultimately unpredictable.
What indicators are most effective for recognizing market turning points?
Swing high and swing low are effective indicators for recognizing market turning points. They identify the highs and lows in price action, signaling potential trend reversals. Traders can use this information to time entries and exits in their trading strategies.
How do market participants use price action to make trading decisions?
Market participants use price action to identify key support and resistance levels, trend direction, and potential reversal patterns to make informed trading decisions. Analyzing swing highs and lows provides insights into the overall market sentiment and can help traders time entries and exits.
What role do support and resistance levels play in swing trading?
Support and resistance levels are key in swing trading as they identify areas where price may reverse. Identifying and trading off these levels can help capture swings in price movements.
How important is it to understand market psychology when trading?
Understanding market psychology is crucial for trading success. Recognizing common behavioral biases and emotions that drive market movements can help traders make more informed decisions and improve risk management.
What are the common mistakes traders make when trying to identify market swings?
Common mistakes traders make when identifying market swings include:
Failing to identify the broader trend direction
Mistaking short-term corrections for trend reversals
Focusing too much on individual swing points rather than the overall pattern
Overreacting to minor price fluctuations and getting whipsawed
Neglecting to use appropriate technical indicators to confirm swing signals
How can a trader differentiate between a true market swing and a false signal?
Traders can differentiate true market swings from false signals by identifying clear patterns in price action, such as higher highs and higher lows for uptrends or lower lows and lower highs for downtrends, rather than relying on isolated price movements.
What tools do traders typically use to analyze market momentum?
Traders typically use technical indicators like moving averages, MACD, and RSI to analyze market momentum. These indicators help identify trends, momentum, and potential reversals in the market.
What defines a significant market swing?
A significant market swing is defined by the formation of swing highs and swing lows, which represent the turning points in price action. Swing highs occur when price makes a higher high followed by two lower consecutive highs, while swing lows form when price makes a lower low followed by two higher consecutive lows.
How do swing traders time the market?
Swing traders identify swing highs and swing lows to time market trends. They enter trades when price breaks above swing highs or below swing lows, indicating a change in trend direction. This allows them to capitalize on short-to-medium-term market movements.
What patterns indicate a swing high formation?
A swing high is formed when price makes a higher high, followed by two consecutive lower highs. This pattern suggests a potential reversal or consolidation in the uptrend.
How do volume indicators influence swing trading?
Volume indicators can help identify swing trading opportunities by highlighting periods of increased buying or selling pressure. Higher volume during a price swing can signal a stronger trend movement. Lower volume during a swing can suggest a potential reversal.
What is the role of candlestick patterns in identifying swings?
Candlestick patterns can identify swing highs and lows. Bullish and bearish candlestick patterns like doji, engulfing, and hammers can signal potential reversals in swing highs and lows during uptrends and downtrends.
How does the Fibonacci retracement tool aid in swing trading?
The Fibonacci retracement tool identifies key support and resistance levels based on Fibonacci ratios, enabling swing traders to identify potential reversal points and manage risk more effectively.
What moving average signals are crucial for swing traders?
The crucial moving average signals for swing traders are the 50-day and 200-day moving averages. When the 50-day MA crosses above the 200-day MA, it indicates a bullish trend. When the 50-day MA crosses below the 200-day MA, it signals a bearish trend.
How do oscillators help in identifying market extremes?
Oscillators like RSI, Stochastics, and MACD can identify overbought and oversold market conditions, signaling potential price reversals or continued trend movements. They help traders spot market extremes and time entries and exits accordingly.
Can pivot points accurately forecast market reversals?
Pivot points can provide useful indicators of potential market reversals, but they should be used alongside other technical analysis tools. Pivot points alone do not guarantee accurate forecasting of market reversals.
What is the impact of economic events on market swings?
Economic events can significantly impact market swings. Positive economic news often leads to stock price increases, while negative news can trigger market declines. Unexpected economic data releases can cause volatility and rapid price movements in the markets.
How do trend lines help in swing trading analysis?
Trend lines identify the overall price direction and highlight levels of support and resistance. They help traders spot swing highs and lows, enabling them to time entries and exits in swing trading strategies.
What risk management techniques are essential for swing traders?
Some essential risk management techniques for swing traders include setting stop-loss orders, diversifying positions, using position sizing, and monitoring risk-to-reward ratios. Proper risk management is crucial for limiting potential losses in swing trading.
How does trader sentiment affect swing trading decisions?
Trader sentiment significantly impacts swing trading decisions. Bullish sentiment encourages entering long positions during swing highs, while bearish sentiment leads to shorting during swing lows. Monitoring sentiment helps identify potential trend reversals.
What time frames are best for swing trading analysis?
Swing traders typically analyze daily, weekly, and monthly time frames to identify potential support and resistance levels, trend direction, and swing highs/lows. The choice of time frame depends on the trader's style and investment horizon.
How do breakouts and breakdowns confirm swing points?
When price breaks above previous swing highs or below previous swing lows, it confirms the continuation of the uptrend or downtrend respectively. Breakouts and breakdowns validate the strength of swing points and indicate a potential trend change.
Can Bollinger Bands predict swing high and low points?
Bollinger Bands can help identify potential swing high and low points. When price touches or moves outside the bands, it may signal an impending swing high or low. However, Bollinger Bands should be used in conjunction with other technical indicators for better trading decisions.
How does relative strength index (RSI) signal potential swings?
The relative strength index (RSI) is a momentum oscillator that measures the speed and change of price movements. An RSI above 70 indicates overbought conditions, while an RSI below 30 indicates oversold conditions, which can signal potential swings in the market.
What chart formations precede a swing reversal?
Swing reversals are often preceded by chart patterns like double tops/bottoms, head and shoulders, and triangle formations. These patterns signal a potential change in trend direction.
How do traders use divergence to anticipate market swings?
Traders use divergence, where the price and an oscillator like the RSI move in opposite directions, to anticipate potential market reversals. When price makes a new high but the oscillator fails to make a new high, this bullish divergence can signal an impending price pullback. Bearish divergence, where price makes a new low but the oscillator fails to do so, can indicate an upcoming price bounce.
What is the significance of swing points in market cycles?
Swing points represent key turning points in market trends. Identifying swing highs and lows can help traders spot trend changes and time entries/exits more effectively. Swing points are fractal in nature, observable across multiple timeframes.
swing high swing low, swing high and swing low, swing low and swing high, swing low trading, what is swing high and swing low


.png?width=720&height=405&name=swing-high-swing-low%20(1).png)
.png?width=720&height=431&name=swing-high-low-trends%20(1).png)
.png?width=720&height=435&name=swing-high-low-support-resistance%20(1).png)
.png?width=720&height=433&name=AAPL-Swing-High-and-Low%20(1).png)


 Trading Strategies


