5 Key Differences between the Stochastic RSI and Stochastic [Updated April 2026]
Apr 24, 2026
Written by: Al Hill
✓ Reviewed by Kunal Vakil, Co-Founder of TradingSim · Updated Apr 24, 2026
While there are many oscillators, the Stochastics and Stochastic RSI are two of the most popular technical indicators.
So, why do we need two indicators with practically the same name?
Let’s go deep into the key differences between the indicators and how you can make money trading with these tools.
The Stochastics oscillator or Stochs for short is a typical range-bound oscillator measuring price momentum. As with other oscillators, the Stochastics displays the location of the closing price relative to the high and low range over a specific period of time.
The Stochastics oscillator’s main purpose is to look for overbought and oversold levels which signify rising and falling momentum. You can use both indicators to identify trending and range bound markets.
History of Stochastics Oscillator
The Stochastics oscillator was developed by George Lane in the 50’s and according to Lane, the Stochastics oscillator was a credible way to measure price momentum [1].
More importantly, Lane believed that changes in momentum often preceded changes in price, in a way making the Stochastics oscillator a type of a leading indicator for price changes by measuring momentum. Lane attributed this theory by comparing the way a rocket lifts off. A famous quote from Lane is that before a Rocket can change direction and turn down; the rocker’s momentum needs to slow. Similarly, when price changes, momentum needs to slow.
Settings
Stochastics can work in both range and trending markets. It just comes down to how you interpret readings between 0 and 100.
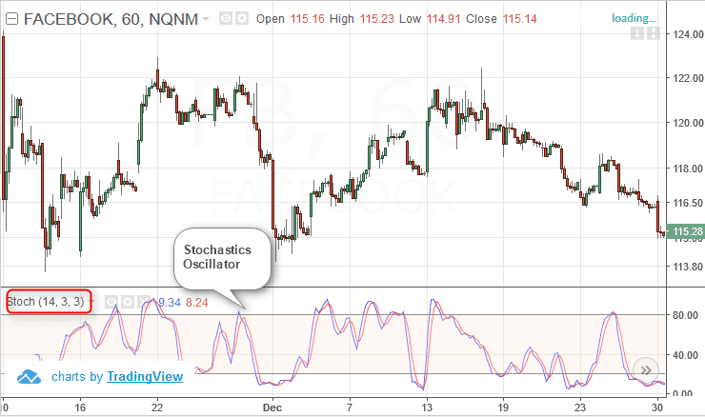
The Stochastics oscillator is comprised of the first line known as %K which displays the current closing prices in relation to the defined high and low period. The second line known as %D is a simple moving average of the %K. The most common setting for the Stochastics oscillator is 14, 3, 3 or simply 14, 3. This simply indicates a 14-period look-back and a 3 period SMA for %K, which is %D.
The chart below shows the typical Stochastics configuration on a price chart.
Example Stochastics indicator with 14, 3, 3, Set up
Additional Types of Stochastics
Besides the 14, 3 or the 14, 3, 3 setting of the Stochastics oscillator, there are other versions such as the full Stochastics and the slow Stochastics.
The slow Stochastics is less sensitive to momentum and as a result, shows a much smoother output. Therefore, the slow Stochastics is better for long-term trend analysis.
Conversely, the fast Stochastics is more sensitive to price momentum and can better signal short-term trend changes.
Trading with Stochastics
The most common way to trade with Stochastics is to combine the indicator with chart patterns and trend lines.
Let me break this down further.
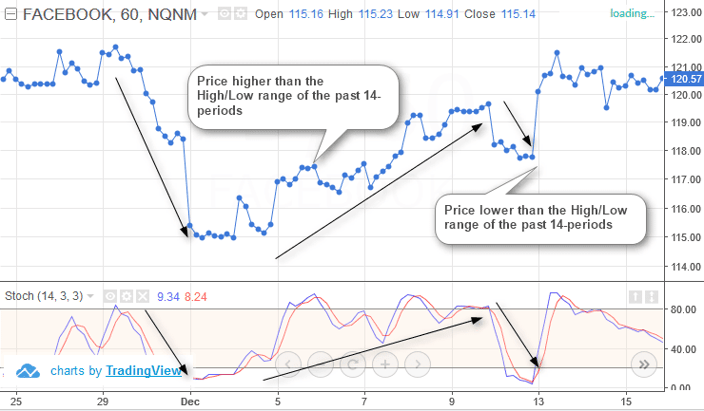
For example, if price closed in the upper half of the range for the past 14 period’s high and low, this is reflected by the %K line rising. This also signals increased momentum and thus more buying pressure in the market.
Similarly, when price closes in the lower half of the range of the past 14 periods, then the %K line falls or slopes down, indicating weakening momentum or increase selling pressure.
The %D is the simple moving average of the %K and similar to the general rules of moving averages, when the %K cuts across the %D line, buy and sell signals are generated or the momentum is seen to increase and decrease even further.
When you combine Stochastic readings with the trend you can also identify buying and selling opportunities.
The chart below depicts how the Stochastics %K line (and thus %D) rise and fall in relation to closing prices.
Stochastics %K and %D lines indicating rising and falling momentum
What is the Stochastic RSI oscillator?
The Stocahstic RSI indicator or Stoch RSI is an advanced version of the Stochastics oscillator. The primary difference being that the Stochastics RSI indicator is known as an indicator of an indicator. The Stoch RSI was developed by Tushar Chande and Stanley Kroll and the indicator was introduced in 1994 in a book called The New Technical Trader .[2]
Stochastics RSI Oscillator
The Stochastics RSI indicator provides a stochastic calculation of the RSI (Relative Strength Index) which is another momentum based indicator. The main difference here being that, the Stochastics RSI measures the RSI, relative to its RSI’s high and low range over the specified period of time.
You can see by now the following relationship.
RSI indicator is based on price
The Stochastic RSI is based on RSI
Thus, the Stochastic RSI is basically two steps away from price. As with all momentum indicators, the Stochastic RSI indicator oscillates between fixed values.
Why Create Another Version of the Stochastic Indicator?
The basic premise behind developing the Stochastic RSI is because the RSI is able to oscillate between overbought and oversold values of 80 and 20 for extended periods of time without reaching the extreme levels of 100 and 0.
Generally, the RSI has overbought and oversold values of 70 and 30. Traders look to enter a trade when the RSI is oversold and exit or trim their positions when the RSI is overbought. But when the RSI starts to move within this range, traders are often left on the sidelines.
In order to address this issue, Chande and Kroll designed the Stochastics RSI to increase sensitivity to the RSI and generate more overbought and oversold signals. However, due to the fact that the Stochastic RSI is an indicator of an indicator, there can be a significant lag between the signals generated by the indicator and the price chart.
Furthermore, the Stochastics RSI can get choppy when markets are range bound and which can lead to false signals.
Settings
The Stochastics RSI values are generally a 14 period look back of the RSI and 3 period SMA. It is commonly referred to as the 14, 14, 3, 3 setting.
When trading with the Stocahstics RSI, there are some key factors to bear in mind.
The Stochastics RSI measures the value of the RSI, relative to the range from the user-defined look back period.
Secondly, you enter the number of periods for the Stochastics RSI directly in the settings.
Finally, there are some key values from the Stochastics RSI oscillator.
RSI is at the lowest point when 14-day Stochastic RSI = 0
The RSI is at the highest point when 14-day Stochastics RSI = 1
RSI is at the middle when 14-day Stochastics RSI = 0.5
The RSI is near the low point when 14-day Stochastics = 0.2
RSI is near the high when 14-day Stochastics = 0.8
Interpretation of the Stochastics RSI Oscillator
Overbought and oversold levels: A Stochastic RSI reading above 0.80 is overbought, while an indicator reading below 0.20 is oversold.
Trends: When the Stochastics RSI oscillator is consistently above 0.50, it reflects an uptrend in prices and when the Stochastics RSI oscillator is consistently below 0.50, it reflects a downtrend in prices
An important point to remember about the Stochastic RSI is that the original indicator did not have the SMA of the %K. However more and more technical charting platforms have started offering the SMA setting of the %K as well making it look similar to the regular Stochastics oscillator.
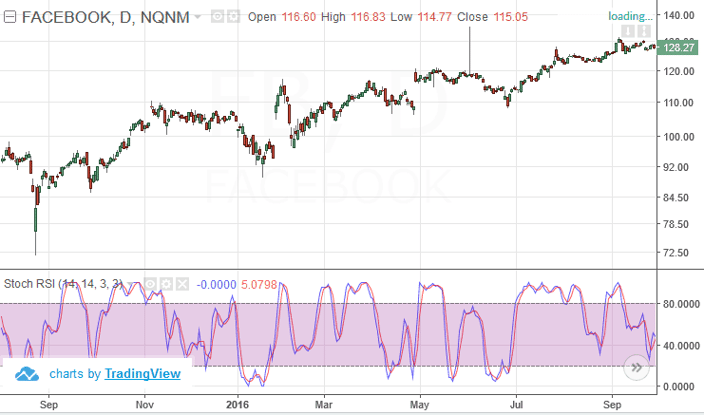
Most charting platforms set the range of the Stochastics RSI to 0 – 100 instead of the original 0 and 1.
Stochastic RSI Indicator showing Overbought and Oversold signals
The above chart shows the Stochastics RSI indicator without the %D or the SMA of the %K. The platform is showing the 80 and 20 values versus the 0.8 and 0.2. Regardless, whenever the Stochastics RSI rises above 0.20 in range bound markets – price rallies.
Conversely, the price can fall when the Stochastics RSI falls below the 80 level.
Five key differences between the Stochastic RSI and Stochastic
Now that we know how the Stochastic RSI and the stochastic oscillator works, here are the five key differences between the two oscillators.
#1 – #3 Different Base of Measurement
The Stochastics oscillator measures price momentum and is based on the closing price as defined by the back period.
The Stochastic RSI, on the other hand, measures the momentum of the RSI and is based on the closing price of RSI, relative to the user-defined high and low range from the RSI’s look back period.
The Stochastics oscillator is based directly from price, whereas the Stochastics RSI is an indicator of an indicator meaning that it measures the momentum of the RSI, which is based on price. In other words, the Stochastics RSI is simply two steps away from price and can, therefore, lag significantly
The regular Stochastics oscillator moves between fixed values of 0 and 100 with 80 indicating the overbought level and 20 indicating oversold levels. The Stochastic RSI, on the other hand, oscillates between 0 and 1 where 0.80 indicates overbought levels and 0.20 indicates oversold levels
#4 Different Scale
Unlike the Stochastics oscillator, you can use .50 as a filter with the Stochastic RSI. Therefore, if the Stochastic RSI continually plots above 0.50, the market is in an uptrend and when the Stochastics RSI plots below 0.50, the market is in a downtrend. Most charting platforms now generally use the Stochastics RSI values to oscillate between 0 and 100 instead of the original 0 and 1 values.
#5 More Signals
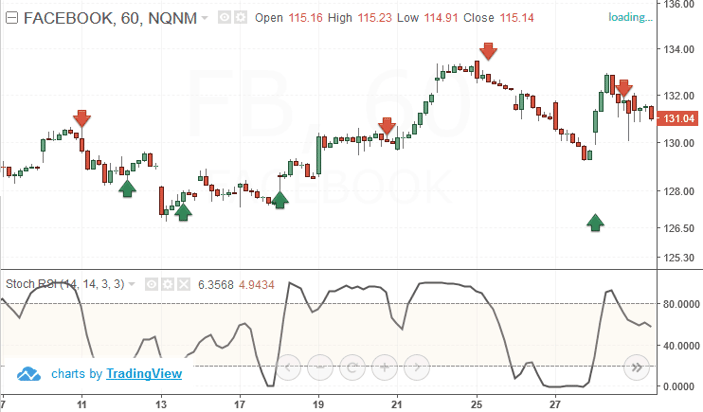
While the Stochastics oscillator is used to measure price momentum and overbought/oversold levels, the Stochastics RSI is designed to be more sensitive and triggers a lot more overbought and oversold levels in comparison to the traditional Stochastics oscillator.
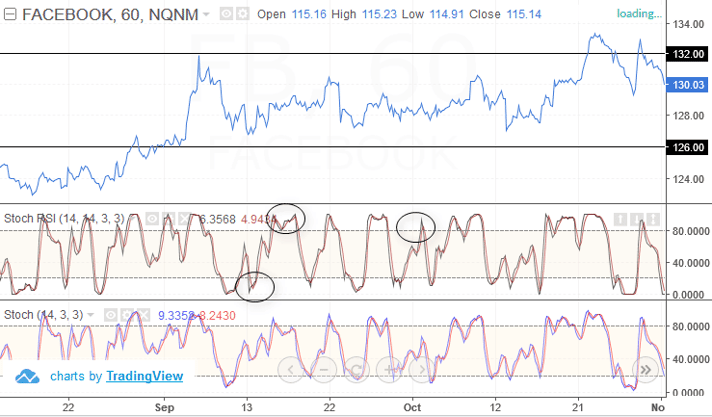
The chart below shows a comparison between the Stochastics oscillator and the Stochastics RSI. You can see how the Stochastics RSI triggers more overbought and oversold levels compared to the traditional Stochastics indicator.
Stochastics vs. Stochastics RSI indicator
Where can Stochastics Fail You?
Like most of my articles, the post would not be complete if I did not share with you how the indicator can absolutely betray you in the real world.
Next, we will cover the two ways the Stochastics will commit an act of treason likely on a daily basis.
#1 – Stochastic RSI Crosses Above and Below 50
I totally get your desire to want to place more trades. However, with each new trade comes the risk of losing on each one. Well, the 50 level is a focus for traders without a doubt. However, are traders willing to jump in at the 50 level or the extremes of 80 and 20?
I think it goes without saying you will likely have fewer participants at the 50.
So, here is where things can get tricky.
If you just trade blindly on the crosses of 5o first you will always be in the market.
Why is that a problem? First, the market does not always provide trading opportunities every second of the day.
Next, commissions will eat you alive. The last thing you want to do is make your broker rich on the back of your hard work. According to author Brian Richards from the Motley Fool, “The more actively you trade, the more money they make.” [3]
The third reason you do not want to trade these crosses of the 50 blindly is the number of false signals. Let me further illustrate this point by looking at some price action.
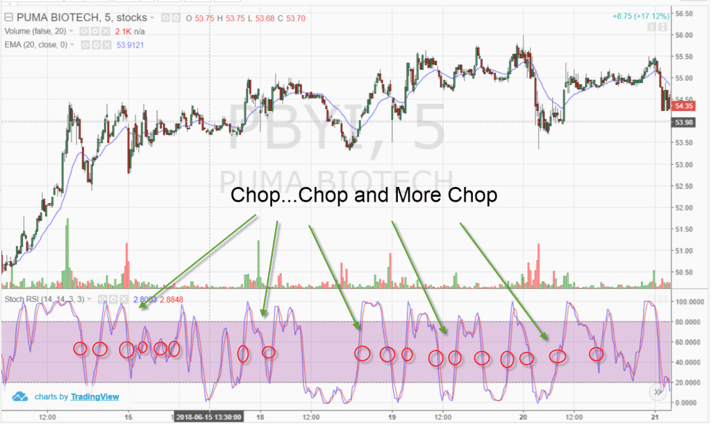
Chop Chop and More Chop
I’m not going to waste my time or yours analyzing each trade signal from the crosses above and below 50 in the chart. Just think about you placing and closing each one of these trades.
The thing people do not talk about enough is the psychological strain you will go through placing these trades. I do not care who you are, at some point, you will start to pass on trading opportunities. As you know, once you do start selecting setups instead of taking each trade, the game is over.
Point is, this is not a strategy that will turn a profit in the long run.
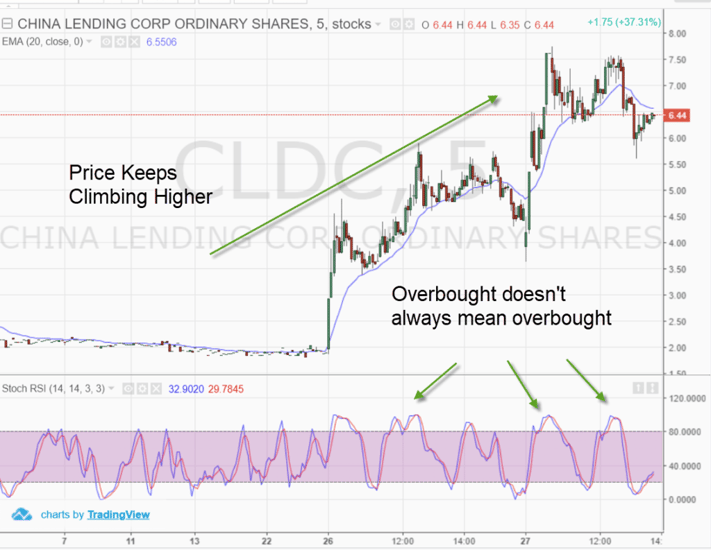
#2 – False Sell Signals
False Stochastic Sell Signals
In the above chart, notice how the stock continues to climb higher after each reading over 80. This is just a prime example of how you cannot blindly short just because the indicator is over 80.
You have to combine other indicators and or chart patterns to validate the sell signal.
Little did I know, the stock would trend lower all day as I averaged down 5 times into the close. Needless to say it was a $4,250 dollar lesson that I will never forget.
In Conclusion
It’s really going to come down to what best fits your trading style. If you are the kind of trader that likes more signals, the Stochastic RSI will meet this need.
The truth of the matter is you just need to pick one and master it. Another option could be to look at both indicators and pinpoint when there is a divergence between the two. This could also help you identify trading opportunities.
Remember to not place too much faith in oversold/overbought readings when the market is trending. Again, oscillators will trigger more false signals if a stock is trending.
The absolute sweet spot for using the Stochastics RSI or Stochasitic indicators is on low volatility stocks. I know what you are saying, “low volatility stocks are boring”.
To be honest, that is a true statement. You are not going to have a 20% intraday move trading Microsoft. However, these large stocks with large floats have predictable moves. This level of predictability bodes will for indicators like the Stochastics which require a clean high low price range.
Additional Resources
Here is a great video on YouTube from Investor Trading Academy that covers oscillators in general. This is a short video which can whet your appetite a little more in these types of indicators.
Also, please be sure to check out more posts on oscillators from Tradingsim. See which oscillator works best for your trading style.
Quick Answer: What is the Stochastic RSI and how is it different from Stochastic?
The Stochastic RSI applies the Stochastic oscillator formula to the Relative Strength Index values — not to price — producing a faster, more sensitive momentum reading. Classic Stochastic measures where price closes inside its recent range; Stochastic RSI measures where the RSI sits inside its own recent range. That second-derivative move makes StochRSI oscillate between 0 and 1 (or 0 and 100) more frequently, giving more signals but also more false ones.
Updated 2026-04-24 by Al Hill, Co-Founder of TradingSim. Verified against current TradingSim market replay data.
The Settings I Actually Run on StochRSI
The default 14-3-3 StochRSI is too slow for day trading and too fast for swing trading. After years of testing on TradingSim's replay engine, I settled on two configurations depending on timeframe:
Intraday (5m, 15m): StochRSI length 14, %K smoothing 3, %D smoothing 3. Oversold below 20, overbought above 80. Use this on liquid large-caps and ETFs during the first and last hour of the session.
If you cannot see a clear %K crossing %D inside the overbought or oversold zone, there is no signal — the indicator is just noise between 0.20 and 0.80.
Three Filters That Separate Tradeable StochRSI Signals from Noise
Filter 1 — Trend alignment. StochRSI is a momentum oscillator, not a reversal tool. In a strong uptrend, ignore overbought signals and use only oversold crosses as re-entries. In a downtrend, ignore oversold signals and use overbought crosses to short rallies. On a chart, that means overlaying a 50 EMA and treating it as the regime filter.
Filter 2 — Divergence. A StochRSI that prints a higher low while price prints a lower low is a bullish divergence worth taking. The mirror — StochRSI printing a lower high while price makes a higher high — is the clearest bearish reversal signal the oscillator produces. I do not trade StochRSI without divergence on the daily.
Filter 3 — Fresh zone entry. The signal bar must be the first %K/%D cross since the oscillator last left the opposite zone. Second and third crosses inside overbought or oversold territory are continuation signals, not reversals. Rule out the re-entries and your hit rate climbs.
When to Use StochRSI Versus Classic Stochastic
Scenario
Better Tool
Why
Tight intraday ranges
StochRSI
More sensitive; triggers inside the range faster
Trending days (strong direction)
Classic Stochastic
Smoother, fewer false reversal calls
Divergence hunting
StochRSI
Higher frequency makes divergence easier to spot
Swing trading daily charts
Classic Stochastic
Slower cadence matches multi-day holds
News-driven chop
Neither — stand aside
Both oscillators produce noise in gap-heavy sessions
A Complete StochRSI Trade Plan
Setup: Price in an established uptrend (above 50 EMA, higher highs and higher lows on the 15-minute chart).
Signal: StochRSI dips below 20, %K crosses above %D, and the cross is the first re-entry since StochRSI last touched 80.
Entry: One tick above the high of the signal bar, pending a close above the 20 EMA.
Stop: Below the swing low that produced the oversold reading, or 1.5x ATR, whichever is tighter.
Target 1: Prior intraday high or 1R, whichever comes first. Scale half off.
Target 2: Trail remainder with a 2-bar low. Exit on StochRSI reaching 80 if still in the trade.
Drill This Setup on TradingSim
StochRSI signals look obvious in hindsight and feel ambiguous in real time. Replay ten trading sessions of your favorite ticker on TradingSim with StochRSI and a 50 EMA on the chart. Mark every signal that clears all three filters. Do not take the trades — just grade them. Once you see the pattern through twenty or thirty clean signals, the real-time calls get easier.
Frequently Asked Questions
What are the best StochRSI settings for day trading?
On 5-minute and 15-minute charts, use StochRSI length 14 with %K smoothing 3 and %D smoothing 3. Treat readings above 80 as overbought and below 20 as oversold. Slower settings (21/5/5) work better on daily charts where you want to filter intraday noise.
Is Stochastic RSI better than RSI?
They answer different questions. RSI measures raw price momentum over 14 bars; Stochastic RSI measures where RSI sits inside its own recent range, making it faster and more sensitive. For identifying overbought/oversold extremes in tight ranges, StochRSI fires earlier. For confirming trend strength, classic RSI is steadier.
How do I read Stochastic RSI divergence?
A bullish divergence occurs when price prints a lower low but StochRSI prints a higher low — momentum is refusing to confirm the new low. A bearish divergence is the mirror: price higher high, StochRSI lower high. Divergence on the daily timeframe carries more weight than on intraday charts.
What does it mean when Stochastic RSI stays above 80?
A StochRSI that pegs at or above 80 for an extended period indicates a strong trending move, not an imminent reversal. During strong uptrends, the oscillator can stay overbought for days. Do not short just because StochRSI is high — wait for a %K/%D cross below 80 combined with a price structure break.
Can Stochastic RSI be used with other indicators?
Yes, and it usually should be. Pair StochRSI with a trend filter (50 EMA or VWAP), a volume confirmation rule, and a clean price structure read. The oscillator tells you momentum shifted; the other tools tell you whether the shift happened at a level that matters.
Reading about Stochastic RSI signals only gets you so far. The shift from concept to instinct happens when you drill the setup across hundreds of sessions. TradingSim's day trading simulator replays real historical market data tick-by-tick, so you can practice identifying and trading Stochastic RSI signals under live-market conditions without risking a dollar. For futures-oriented traders, the futures simulator covers ES, NQ, CL, and GC with the same realistic replay engine.
Alton Hill is the Co-Founder of TradingSim with over 18 years of trading experience. He completed the Design Thinking Bootcamp at Stanford’s D.School and brings expertise in Product Development to create the best trading simulation experience. His strategy focuses on trend-following systems, targeting high-volatility stocks with strong primary trends using the 15-minute chart.
Slow Stochastics –Strategies, Calculations and Difference Between RSI
In this article, I am going to discuss the basics of the slow stochastics indicator and then dive into trading strategies you can test in the market. Slow Stochastic Definition The slow stochastic...
Williams %R Indicator – 3 Trading Strategies and Formula
I feel like I am on an oscillator craze lately, but if it feels right, why fight it? The Williams %R indicator is pronounced Williams Percent R. The indicator is the creation of famous technical...
Ease of Movement Indicator (EMV) – The Best Way to Interpret Price Action
What is the Ease of Movement Indicator? The Ease of Movement (EMV) is an oscillator, which analyzes the relationship between price and trading volume. The EMV indicator has an uncanny ability to...


 Day Trading Indicators


