The Shooting Star Candlestick Pattern & the Hammer Candlestick Pattern [Updated May 2026]
May 3, 2026
Written by: Al Hill
✓ Reviewed by Kunal Vakil, Co-Founder of TradingSim · Updated May 3, 2026
The shooting star is a single bearish candlestick pattern that is common in technical analysis. The candle falls into the “hammer” group and is a first cousin of the – hanging man, hammer, and inverted hammer. If you’re unfamiliar with any of these patterns, check out our Quick Reference Guide.
In this post, we will discuss the following topics:
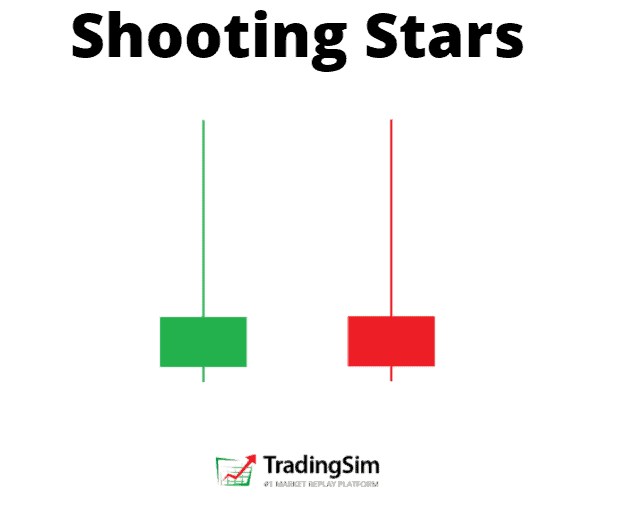
The shooting star has a small body and a very long upper candle wick.
As you see, the candle has a small body located in the lower part of the pattern.
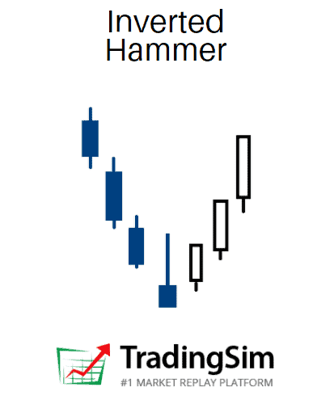
However, this also looks like an inverted hammer candle pattern.
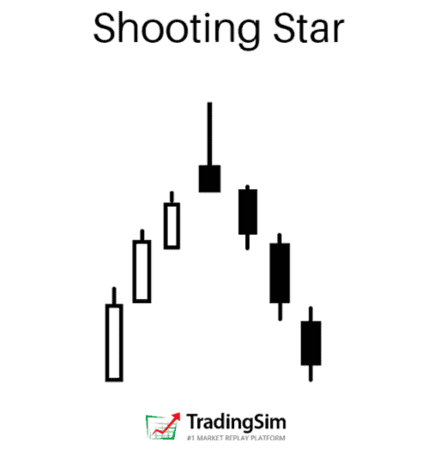
Shooting Star Pattern
A hammer candlestick pattern is almost identical to a shooting star. So, how can we distinguish the two? The answer to this question is hidden in the price direction before the creation of the candle.
The shooting star candle is a reversal pattern of an upwards price move. The inverted hammer occurs at the end of a down trend. That being said, you can also have variations of the two.
For example, you can have a hammer candlestick pattern at the top of an uptrend which will also signal a reversal. In other words, the wick (tail) doesn't have to point in the opposite direction of the new trend. It simply needs to show that there was selling pressure coming at the highs or lows of the reversal.
How to trade the shooting star candlestick pattern
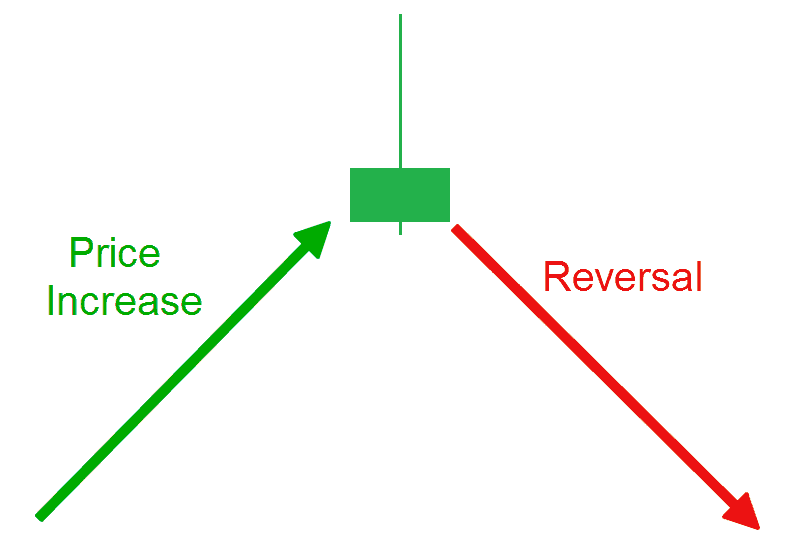
If a stock is in a bullish uptrend and you identify a shooting star candle, then there is a solid chance that the trend will reverse. For this reason, traders use this candle to enter short trades on the assumption that the bullish move is running out of steam.
shooting star candlestick potential
Once you are able to identify the shooting star, you should look to open a short position on a break of the low of the candle.
The expectation for the profit potential for the shooting star is 3:1 the size of the candlestick.
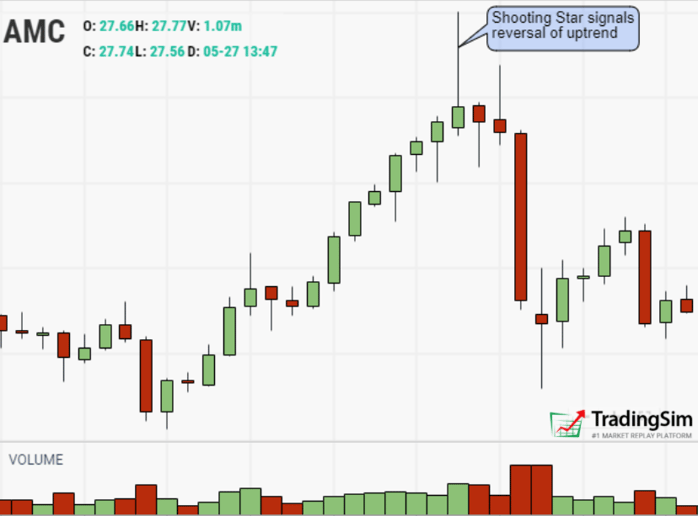
Here is an example with AMC. Note that we are aiming for 3x the width of the shooting star candle:
AMC bearish shooting star candlestick pattern
How to trade the hammer candle
Look once again at the image of the AMC chart above. Noice the red candle that follows immediately after the annotated shooting start? That's right, it is a hammer candle.
The reason we point this out is that often a hammer candle will precede a trend reversal in the same way that a shooting star will. As we will discuss in a moment, the psychology behind these candles are everything.
In order to trade the hammer candle, you want to wait for the low of the wick to be broken to the downside. On the chart above we get that hard break just two candles later. You can enter there, then set your stop at the high of the hammer candle, or the shooting star candle, whichever you prefer.
Psychology of the Pattern
The shooting star candlestick is considered one of the most reliable candlestick patterns. One of the reasons for this is the unique structure – a small body with a high upper candlewick.
The psychology of the trade has many layers of complexity.
First, buyers are enjoying their gains as the stock shoots to a climactic high. As this euphoric moment begins to set in, short traders begin to sell the stock on a flurry of buy orders.
At this point, the longs who were late to the party begin to get scared and start to sell out as well. This panic long selling and short selling leads to a sharp reversal in the price action, thus generating a small candlestick body on the chart.
It is important to mention that the shooting star candlestick pattern is even more reliable when it develops after three consecutive bullish candles.
This creates exponential bullish pressure on the chart. In other words, exhaustion.
In such cases, the shooting star candle is likely to have an even bigger upper candlewick. This implies that the price is about to reverse with even bigger strength.
3 Steps For how to use the Shooting Star or Hammer candle to buy/sell stocks
Now that you have a good understanding of what the shooting star and a hammer candlestick pattern are, let's take a look at how to use them to buy/sell stocks. We'll use a few examples of real trades.
1) Trade Entry
Before entering a shooting star trade, you should first confirm the pattern.
Here are handful of criteria to ensure success:
Identify an active bullish trend.
Spot a candle with a small body and a big upper candlewick.
Wait for a bearish candle to break the low point of the shooting star body.
Ensure elevated volume, signifying heavy supply
This will confirm the validity of your shooting star on the chart.
If you are able to identify the presence of these signals, then you should short the security. After all, you are anticipating an upcoming bearish price move.
You should always use a stop-loss order when trading the shooting star candle pattern. After all, nothing is 100% guaranteed in stock trading, and you may experience false signals when trading the shooting star pattern.
For this reason, place the shooting star candle pattern above the upper wick of the pattern.
3) Taking Profits
The price target for the shooting star is equal to the size of the pattern (the length of the candle).
Similarly, our target is for a price move equal to three times the length of shooting star, including the wick.
Shooting Star Trading Strategy
Now that we have the shooting star confirmation criteria behind us, we will combine these three basic steps into a trading strategy.
Example #1
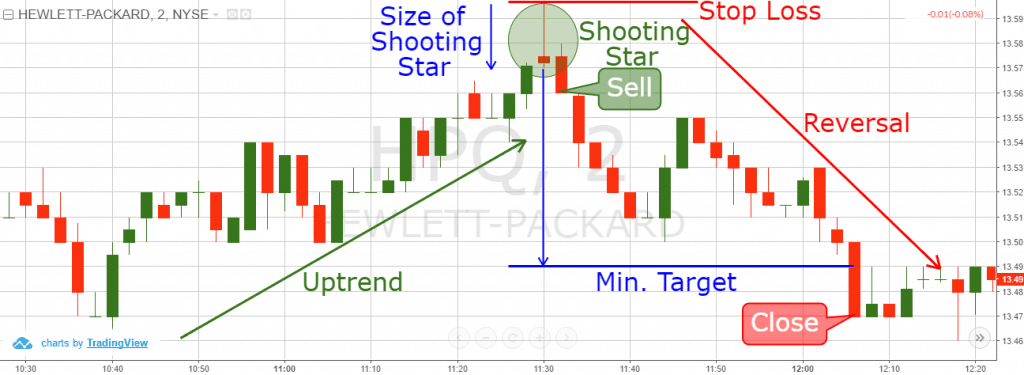
This is the 2-minute chart of Hewlett-Packard from June 10, 2016. The image illustrates a classical shooting star trading example.
shooting star trading strategy
Our trading analysis starts with identifying that the price is trending upwards.
Suddenly, a shooting star candlestick appears, which is marked with the green circle on the chart. We have a small candle body and a big upper candlewick, which confirms the shape of the pattern.
Entry
The next candle after the shooting star is bearish and it confirms the pattern.
Therefore, we sell the security after the pattern confirmation. At the same time, we place a stop loss order above the upper wick of the shooting star candle in order to secure our short trade.
This way, if the price creates an unexpected bullish move caused by high volatility, we will be protected.
Our maximum loss will be equal to the distance between the level we short HPQ and the level of the stop loss order.
The first blue arrow on the image measures the size of the candlestick. According to our shooting star trading strategy, we should seek a target equal to three times the size of the pattern.
Profits Raining
Thus, we apply the size of the pattern three times starting from the lower candle wick. This is how we get the big blue arrow, which points out the minimum target of our trading strategy.
shooting star trading strategy
In order to maximize our profits, we need to stay in the trade until the price action closes a candle beyond the minimum target.
On the way down, the price creates one correction during the bearish move. The downward activity then resumes and 18 periods after we short HPQ, the price action closes a candle below the minimum target of the pattern.
Exit
Luckily, this candle is relatively big and goes way beyond the minimum target. A perfect opportunity to exit.
As you see, the shooting star candle pattern gives us an indication that the trend might reverse. This creates a nice premise to short HP right in the beginning of an emerging bearish trend. Despite the small correction on the way down, the shooting star reaches the target of three times the size of the candlestick.
Example #2
Let’s now try this strategy one more time on another shooting star trading example:
shooting star trading strategy 2
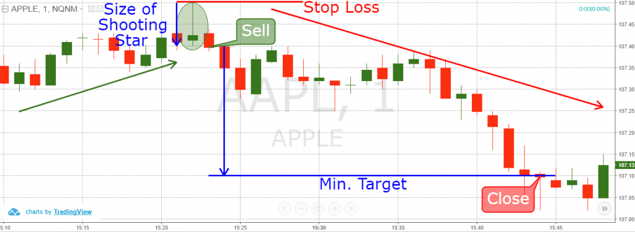
We now have the 1-minute chart of Apple from December 22, 2015.
The chart starts with a price increase – Apple creates higher highs and higher lows. On the way up, the price action forms a shooting star candlestick pattern on the chart (the green circle on the image).
Now we have a reason to believe that the price action could be reversed. We wait to see if the next candle is going to confirm the authenticity of the shooting star reversal pattern.
Entry
Fortunately, the next candle is bearish and breaks the low of our shooting star candle on the chart. This gives us a strong bearish signal and we short Apple at the end of the bearish candle. At the same time, we place a stop loss order at the highest point of the shooting star – above the upper candlewick.
Now, the trade is protected against rapid price moves contrary to our trade.
Raining Profits
The blue arrows on the image measure and apply three times the size of the shooting star candle pattern. After we short Apple, the price enters a downtrend.
After the first bearish impulse on the chart, the price creates a range between $107.30 and $107.40 per share. The range is then broken and the price action creates a new bearish impulse on the chart.
This impulse leads the price to complete a total bearish move of three times the size of the shooting star pattern. This is the minimum target for our trade and we close the position.
Another successful trade in the books.
Recap
The shooting star falls into the “Hammer” candle family.
There are three basic tricks for trading the shooting star candlestick figure:
Sell the security after the creation of a bullish trend, a shooting star candle, and a bearish confirmation candle.
Put a stop loss right above the upper candlewick of the shooting star figure.
Stay in the short trade for a bearish price move equal to at least three times the size of the shooting star candle including the upper and the lower candlewick.
This shooting star trading strategy contains around 3:1 Win-Loss ratio.
How to Practice This Strategy
If you find yourself overwhelmed or new to the shooting star candlestick pattern and other formations, the best way to get a firm grasp of the strategies is through deliberate practice.
There is no more efficient way of doing that than in a trading simulator with a realistic trading environment.
To that end, we’ve put together a handful of reference guides for the best bullish and bearish candlestick patterns to help guide you along the way. So, be sure to check those out and download our cheat sheets.
Frequently Asked Questions
What is a shooting star candlestick pattern?
A shooting star is a single bearish reversal candle with a small real body near the session low and a long upper wick at least twice the body. It forms at the top of an uptrend and signals that buyers failed to hold the highs.
Is a shooting star bullish or bearish?
A shooting star is bearish. It marks a rejection of higher prices after an uptrend and often precedes a short-term reversal, especially when followed by a confirming bearish candle on the next session.
What is the difference between a shooting star and a hammer?
A shooting star appears at the top of an uptrend and signals a bearish reversal. A hammer appears at the bottom of a downtrend and signals a bullish reversal. The candle shape is similar; the trend context determines the pattern.
How do you trade a shooting star?
Wait for a confirming bearish close after the shooting star, enter short on the close or break of the confirmation candle's low, place a stop just above the shooting star's upper wick, and target a move of roughly three times the candle's range.
How reliable is the shooting star pattern?
Reliability improves with three signals: a clear prior uptrend, an upper wick at least twice the real body, and elevated relative volume on the candle. Without volume confirmation, shooting stars often fail at intraday resistance.
Where does the shooting star fit in the candlestick family? The shooting star belongs to the hammer family of single-candle reversal patterns, alongside the hanging man, hammer, and inverted hammer. Each of the four shares a long wick and small body, but the wick direction and prior trend determine which pattern is in play.
What stop and target make sense on a shooting star trade? Most discretionary traders place a stop a few cents above the shooting star's upper wick and target a measured move of three times the candle's high-to-low range. That structure produces a 3:1 reward-to-risk profile on confirmed entries.
Alton Hill is the Co-Founder of TradingSim with over 18 years of trading experience. He completed the Design Thinking Bootcamp at Stanford’s D.School and brings expertise in Product Development to create the best trading simulation experience. His strategy focuses on trend-following systems, targeting high-volatility stocks with strong primary trends using the 15-minute chart.
Studying the stock market’s past in order to try to predict the stock’s future is referred to as technical analysis. Trading Options Trading options are a form of security that you can invest and...
The Stick Sandwich Candlestick Pattern + Chart Examples
Candlestick patterns have been around for centuries. They are very useful in finding reversals and continuation patterns on charts. While we discuss them in detail in other posts, in this post we...
Day Trading Setup – Three Bar Reversal and Go This article is going to discuss a very simple, yet powerful day trading strategy that is used to capitalize off the greed and fear from novice traders....


 Investment Articles


