Today we will discuss one of the most popular continuation formations in trading – the rectangle pattern.
How can something so basic as a rectangle be one of the most powerful chart formations?
Well, wait no further, we will show you how to identify the pattern and the 5 essential steps to trading the rectangle formation.
The Meaning of the Rectangle Pattern in Technical Analysis
The rectangle figure is a trading pattern which can appear during bullish and bearish trends. The pattern consists of tops and bottoms, which are parallel to one another. The other key point to illustrate is that the highs and lows are all horizontal.
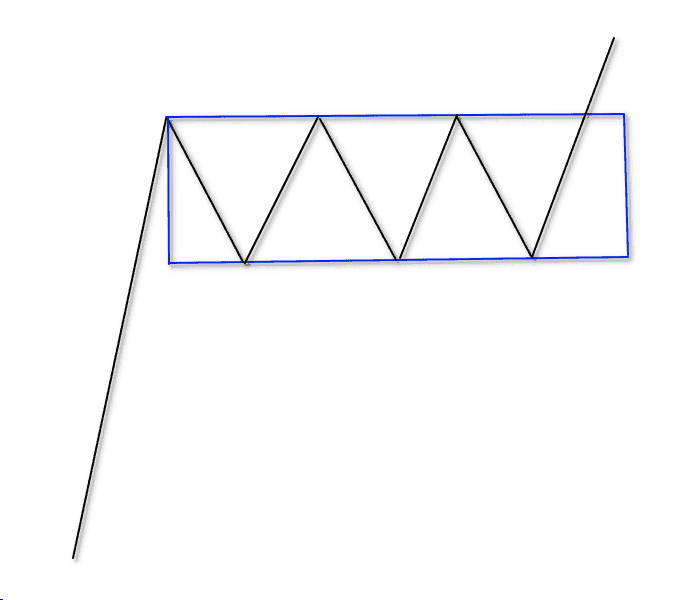
Rectangle Pattern
This is a simple sketch of the rectangle chart pattern. The image shows how after a trend the price enters a range which has a rectangular shape.
Types of Rectangle Patterns
Bullish Rectangular Pattern
The bullish rectangle is a continuation pattern that develops during a strong uptrend.
Once the pattern is established, a break to the upside would imply a continuation of the bullish trend.
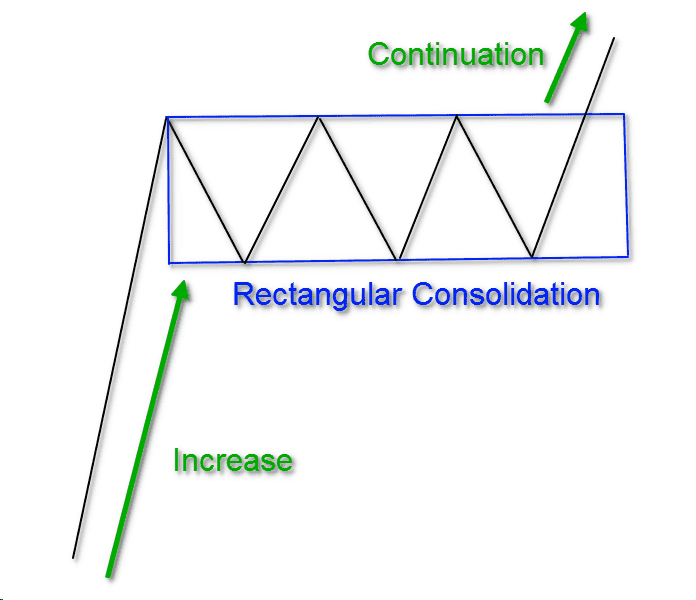
Bullish Rectangular Pattern
The sketch begins with strong uptrend that then flows into a consolidation period.
The power of the rectangle is that it creates a battle between the bulls and bears, that’s once resolved leads to a powerful move.
For all of my Richard Wyckoff fans, this is what we like to call “cause”. It’s hard to see “cause” on a candlestick chart, but if you pull up a point and figure chart, you will see the price projection based on the number of x’s/o’s is huge!
Therefore, once the pattern breaks, the stock can really begin to run.
the price increase and ends up with a consolidation with the shape of a rectangle.
Bearish Rectangular Pattern
The bearish rectangular pattern is the mirror image of the bullish pattern.
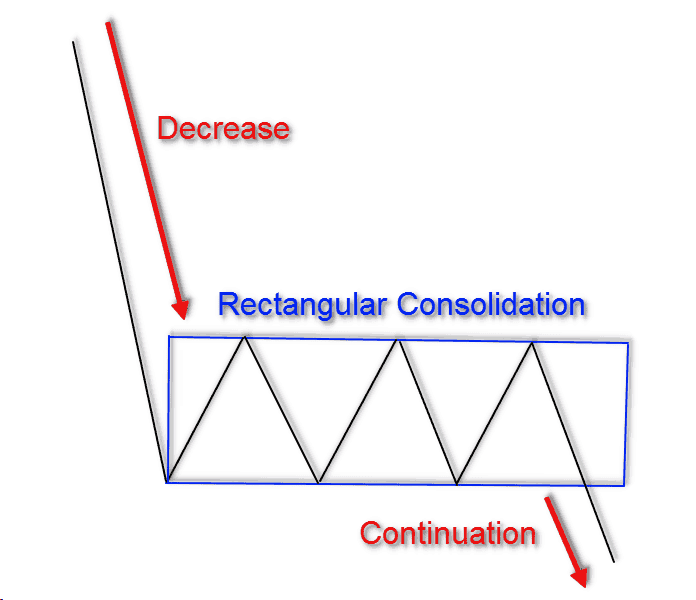
Bearish Rectangular Pattern
As you see on the sketch above, the bearish rectangle figure starts with a price decrease. The price action then changes to a range with a rectangular shape.
If you spot a confirmed bearish rectangle, you should open a short position, once the stock breaks the bottom of the range.
5 Steps to Trading the Rectangle Formation
Now that you are familiar with the pattern, let’s walk through how to trade the rectangle formation.
Step 1: Identify the Rectangle Pattern
To identify the rectangle pattern, you first need to find a trending stock that is experiencing a consolidation period.
You will need to identify a minimum of two tops and two bottoms that are horizontal with one another.
These two tops and bottoms will create the support and the resistance levels of the rectangular range.
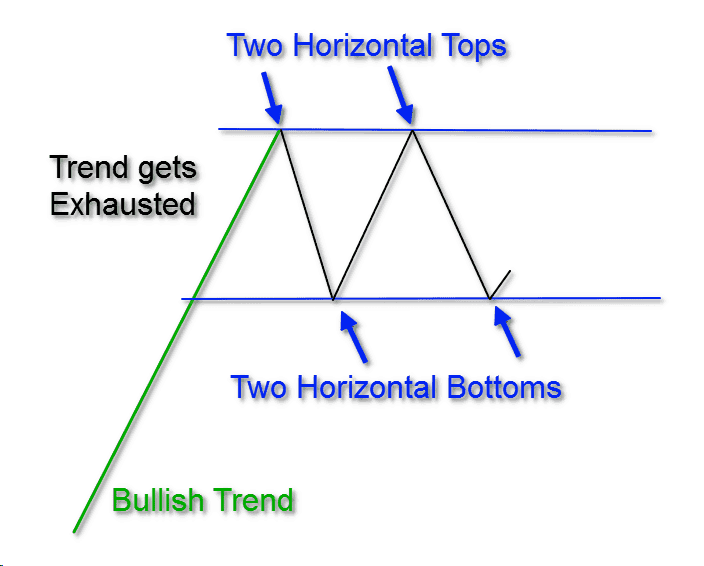
Identifying the Rectangular Pattern
This image shows the two tops and bottoms you need in order to identify a rectangular pattern on the chart. See that the image starts with a bullish trend, which becomes overextended and begins to go flat.
The pause in trend creates the first top. The next three price swings create a bottom, another top, and another bottom respectively. This stock behavior creates the impression that the price is locked inside a box.
When you see the price action hesitating, or bouncing for second time from the lower level, then you have confirmed the pattern.
Step 2: Spot a Rectangle Pattern Breakout
If the rectangle is bullish, you would need to see a breakout through the upper level of the pattern. This will confirm that the bullish move is resuming.
If the rectangle is bearish, then price would need to break the lower level of the figure for confirmation. In this case, we will have a signal on the chart that the price could initiate a new bearish move.
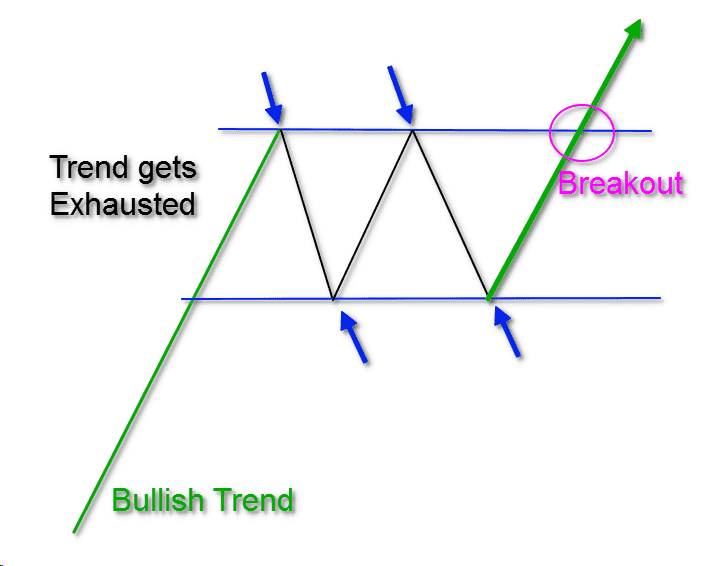
Rectangle Pattern Breakout
The image above shows how the breakout should look on a bullish rectangle. Notice that in our example we use two tops and two bottoms to form the pattern. However, the tops and the bottoms could sometimes be three or four on each level.
Step 3: Enter a Rectangle Trade
To open a position, you would first need to spot a rectangle breakout in the direction of the paused trend. Then you simply buy the stock if the rectangle is bullish, or you sell the stock if the rectangle is bearish.
Step 4: Secure Your Rectangle Trade with a Stop
You should not leave your rectangle trades to chance.
Like any other trading formation, you should use a stop loss order for managing your position.
When you spot the rectangle breakout you should measure the distance between the rectangle resistance and support. Then you should put your stop loss in the midpoint of this length.
This way your trade will be secured. Then you will know that the maximum you can lose from this trade is equal to half the size of the pattern.
This is how a stop loss order should be placed in a rectangle trade:
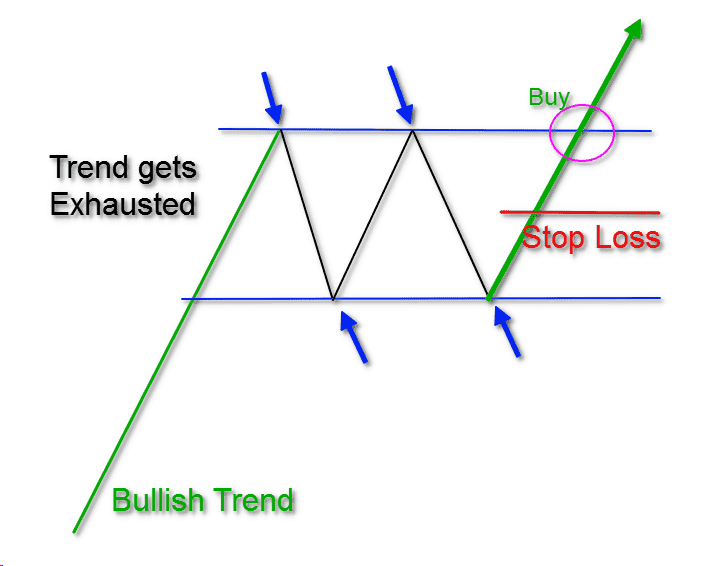
Rectangle Pattern Stop Loss
After you buy a security on a rectangle breakout pattern, your stop loss should be positioned as shown on the sketch above.
The reason we place the stop at the midpoint is because the breakout will likely have a shakeout before continuing the trend.
Therefore, if you place the stop right at the breakout point, the “smart” money will likely hit your stop to acquire more shares, before starting the run higher.
Step 5: When to Exit the Rectangle Pattern
There is a clearly stated rule about the minimum target of the rectangle trades.
When you trade the rectangle pattern, you should stay in your trade for a minimum price move equal to the size of the pattern.
This means that the distance between the support and the resistance of the rectangle, should be applied on the chart starting from the breakout moment.
Since your stop loss is in the middle of the rectangle range, this means that your target equals twice the size of the stop. This creates a win-loss ratio of 2:1.
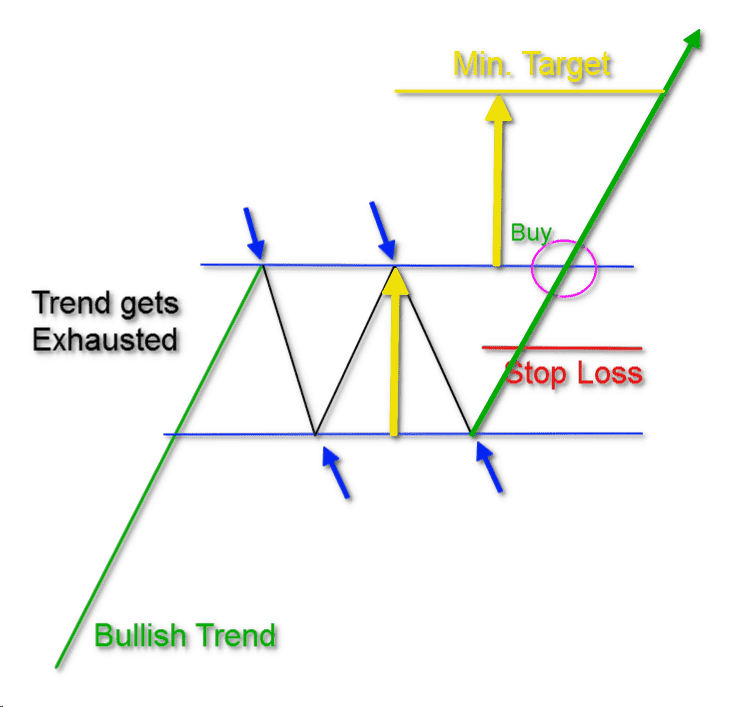
Rectangle Pattern Profit Target
The yellow lines on our sketch show the minimum potential we need to expect when trading rectangles.
However, this is not all of it. In most of the cases the price action continues with a further move in the direction of the trend.
Sometimes we will be entering the second leg of the run, which can at times outpace the first leg up.
If you notice the stock is becoming really impulsive, then you can use swing lows or other indicators like a moving average to determine when to exit the position.
Rectangle Trading with Ascending Tops and Descending Bottoms
Let’s now explore how you can hold onto a trade beyond the initial target of the size of the rectangle.
If the rectangle is bullish, we will hold the trade as long as the price action is creating ascending bottoms on the chart. We will close the trade when we see descending tops and descending bottoms.
If the rectangle is bearish, we will stay in the trade as long as the price is printing descending tops. We will close the trade when we see ascending tops and ascending bottoms
Let’s now approach a real trading example of a bearish rectangle:
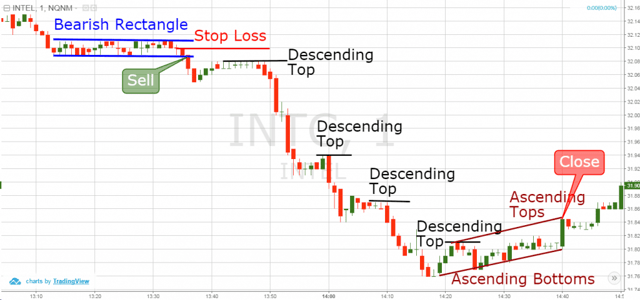
Rectangle Pattern Ascending Tops and Ascending Bottoms
Above you see the hourly chart of Intel. The image illustrates the day of April 14, 2016 and it shows the potential of the rectangular chart pattern.
The chart starts with a price decrease and a consolidation which has a rectangular shape.
The pattern is marked with the blue lines on the chart. As you see, the price creates three bottoms and three tops which are lined up on horizontal levels.
Therefore, we confirm the presence of the pattern and we short INTC when a breakout through the lower level appears.
We then place a stop loss in the middle of the pattern as shown on the image with the red horizontal line.
After we sell Intel, the price enters a strong downtrend.
As you see, the price action creates four descending tops, which are shown with the black lines on the image.
After the fourth descending top, the price action prints a higher high. At the same time, a higher bottom also develops on the chart.
These are shown with the brown lines on the image. Therefore, we received our exit signal based on these bullish developments and we exit the Intel trade.
Let’s now approach a bullish rectangle chart pattern:
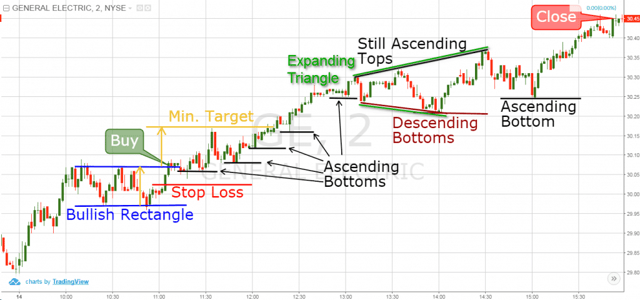
Rectangle Pattern Ascending Tops and Ascending Bottoms 2
Above is the 2-minute chart of General Electric from June 14, 2016. The image shows a bullish rectangle top pattern.
The pattern is marked with blue lines on the chart. We need to buy GE the moment the price action breaks through the upper level. This happens after the bounce at the second bottom inside the pattern.
Therefore, we buy GE and place a stop loss order in the middle of the rectangular range.
One hour later, General Electric completes the minimum target of the bullish rectangle.
On the way up, the price action creates an ascending bottoms pattern. Each of the lows on the chart is higher than the previous one. This indicates the presence of a bullish trend on the chart.
Suddenly, the price action creates a descending bottom on the chart. However, the tops are still ascending.
In order to close the trade, we need to see descending tops and descending bottoms on the chart.
This would indicate the exhaustion of the bullish trend. The price action, though, does not give this signal on the chart.
The green lines on the image illustrate this behavior. This is an expanding triangle, which has bullish potential. Therefore, we hold our long rectangle trade.
The next bottom on the chart is ascending, which indicates that the bullish trend is still present on the chart. The price then creates another bullish impulse before the market closing.
We only exit the trade because we are day trading and do not want the risk of holding a trade overnight.
Conclusion
- The rectangular pattern is one of the basic chart figures in trading.
- Rectangles in trading have trend continuation character.
- You have a rectangle on the chart when the stock interrupts a trend and creates at least two tops and two bottoms on horizontal levels. This way the price action looks like being locked in a box.
- There are two types of rectangle patterns:
- Bullish Rectangle: It relates to bullish trends and has the potential to continue this bullish trend.
- Bearish Rectangle: It concerns bearish trends and it is likely to continue the bearish trend.
- The 5 steps to trading the rectangle formation are:
- Identify a rectangle on the chart.
- Spot a rectangle breakout.
- Enter a rectangle trade in the direction of the breakout.
- Put a stop loss in the middle of the rectangular range.
- Stay in the trade until the price action completes at least once the size of the pattern. You can hit for further profit if the price action rules allows it.
- One of the best indicators to trade rectangles is the Ascending Bottoms and the Descending Tops indicator.
- Stay in your bullish rectangle trades as long as the price action creates ascending bottoms. Close the trade when the price action confirms descending tops and descending bottoms.
- Stay in your bearish rectangle trades as long as the price action creates descending tops. Close the trade when the price confirms ascending tops and ascending bottoms.
Looking for more information on the rectangle pattern? Check out this brief blog post from Peter Brandt, where he shows how the pattern not only works for equities but also the commodities markets as well.


 Chart Patterns


