✓ Reviewed by Kunal Vakil, Co-Founder of TradingSim · Updated Mar 29, 2026
Whether you want to believe it or not, Fibonacci levels play a critical role in defining support and resistance levels when day trading.
Not covered much in the trading community is the impact or rather influence Fibonacci extensions have on day trades and how to trade Fibonacci extensions. In this article, we are going to cover foundational topics related to Fibonacci extensions and how you can incorporate straightforward tactics into your trading regiment.
Fibonacci levels are a standard measure for support and resistance levels within the market. These levels are calculated by analyzing the retracement levels between two swing points. The next question we have to ask ourselves as traders, is what happens when price exceeds the very swing points we use to calculate our fibonacci levels? At what point do we look to exit our position? The key to these questions are fibonacci extensions. Fibonacci extensions provide price targets that go beyond a 100% retracement of a prior move. The levels for fibonacci extensions are calculated by taking the standard fibonacci levels and adding them to 100%. Therefore, the standard fibonacci extension levels are as follows: 138.2%, 150%, 161.8%, 231.8%, 261.8%, 361.8% and 423.6%.
Identifying Fibonacci Extension Levels
The first step in drawing fibonacci extension levels is to identify two clear swing points. These point should be in relation to both your current timeframe and length of trend. In the below example we will be reviewing the fibonacci extension levels for Provident Bankshares (PBKS). As you can see, the stock was able to exceed its high of $18.76. Once PBKS exceeded this prior swing high, the stock began an impulsive move up that would not face any real resistance until achieving its 261.8% retracement level.
Fibonacci Extensions
Trading at Fibonacci Extensions
The last part of the fibonacci extension equation, is what to do when the asset hits the respective target. The first inclination is to immediately close your position at the next fibonacci level. Traders will have to fight this urge and wait to see how the stock reacts at these fibonacci extension levels. Remember, the stock has exceeded previous swing highs and could very well start an impulsive move.
The methodology behind this trading strategy is to confirm breakouts above or below Fibonacci extensions with the awesome oscillator (AO).
The most important AO signals are:
Zero Level Crosses
This is when the bars of the awesome oscillator move from positive to negative territory and vice versa.
Saucer
Saucers are specific formations on the AO indicator itself. A bullish saucer occurs when there are two red bars, where the second one is lower, followed by a higher green bar. At the same time, the bearish saucer has two green bars, where the second one is lower, followed by a red bar.
Trend Lines
Trend lines could be placed on the awesome oscillator. In this manner, if an AO trend is broken, it gives a long or short signal, depending on the direction of the trend and the breakout.
Yes, that is correct. Chart patterns can be found on the AO. Some of these are double top, double bottom, triple top, triple bottom, head and shoulders, triangles, etc.
Since we now discussed how to set entry points with Fibonacci extensions and AO we now need to determine trade exit rules. Here, I recommend you not to over complicate things. It is enough to see the AO bars cross the zero level in order to exit the market. In other words, if you are short, you need to see the AO closing a bar above zero. If you are long, you need the AO to close a bar below zero.
Let’s now see the Awesome Oscillator in action with Fibonacci extensions:
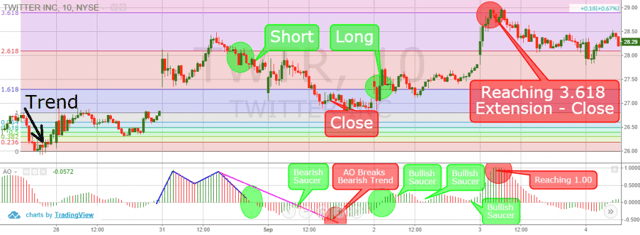
Fibonacci Extensions + Awesome Oscillator
This is the 10-minute chart of Twitter from Aug 27 – Sep 4, 2015. In the beginning of the chart you will see a small bearish trend. This is where we develop our Fibonacci retracement levels. As you see with the market opening on Aug 31, Twitter creates a big bullish gap through the 1.618 Fibonacci extension level. Twitter then continues moving strongly and the price is able to breach the 2.618 extension level.
We see no sell signals from the AO, so we hold. At the same time, the AO creates a double top (blue). Meanwhile price breaks in a bearish fashion through the 2.618 extension. AO supports the bearish move with the double top and break below zero and we short Twitter.
On its way down, the price finds support at the 1.618 extension level. AO gives us a bearish saucer, which signals us to keep our short trade. The awesome oscillator also creates a bearish trend (purple line). In the red circle we see the moment when the AO breaks the bearish trend. This is when we close our position. This trade brought us a profit of 90 cents per share.
Twitter drops to the 1.00 Fibonacci level afterwards. The price tests the level for a while and a new bullish trend appears. Ultimately, the price breaks the 1.618 extension level in a bullish direction. At the same time, the AO crosses above zero. We recognize these two signals and go long.
Twitter starts a consolidation around 1.618; meanwhile, we get three bullish saucers from the AO, which supports our long position. After the third saucer, the price explodes in a bullish fashion reaching the 3.618 Fibonacci extension level. At the same time, the AO reaches 1.00, which is considered high enough to close any long position. We exit the market with a gain of $1.16 per share.
In this Fibonacci retracement strategy, I will combine Fibonacci extension breakouts with buy/sell signals from the KST indicator.
When the stock price breaks a Fibonacci extension, I will first confirm it with the KST before entering the market. When I see an extension break, I need the two KST lines to cross upwards in order to go long. Conversely, I need the two KST lines to cross downwards to go short. This is when we are going to enter the market. We hold the position as long as the KST supports the price direction. We exit the market when the KST lines cross in the opposite direction.
The KST indicator could also indicate an underlying divergence in the stock price. It works the same way as with the awesome oscillator with the one difference that the KST has lines and not bars. The price could move upwards while the KST creates lower tops or bottoms – bearish divergence. At the same time, the price could move downwards, while the KST tops and bottoms close higher and higher – bullish divergence.
Let me now introduce you to the Fibonacci retracement extension levels with the KST indicator:
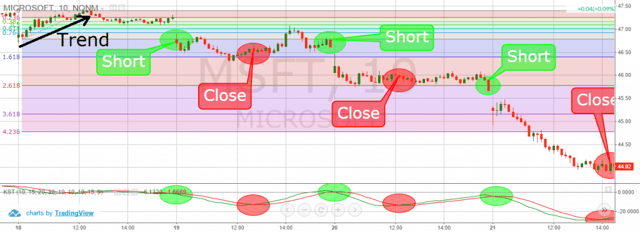
Fibonacci Extensions + Know Sure Thing Indicator
This is the 10-minute chart of Microsoft from Aug 18-21, 2015. We have placed the Fibonacci retracement levels on a small trend shown in the upper left corner. The price starts dropping and it breaks the 100% Fibonacci level.
At the same time, the KST lines cross in a bearish direction. The two signals confirm the price action and we go short. The price drops to the 1.618 Fibonacci extension level and the KST lines then cross in a bullish direction. We close our short position. This trade brought us 20 cents per share profit in 3 hours.
Microsoft increases afterwards reaching the 61.8% Fibonacci retracement level. When the price drops again, it breaks the 1.00 Fibonacci level in a bearish direction. At the same time, the KST lines crosses downwards. We get two new matching bearish signals and we short MSFT again. Price drops through the 1.618 retracement level like a rock. Then Microsoft finds support at the 2.618 Fibonacci extension level, while the KST lines cross upwards. This is our signal to close the trade with a profit of 60 cents per share.
After consolidating for a while, MSFT breaks the 2.618 extension level in a bearish fashion at the same time the KST lines cross downwards. Based on this action, we open another short position.
An impulsive move down begins and we were able to book $1.70 per share in profits.
#3 – Fibonacci Extensions + Volume
As I have said many times, you should always consider trading volume when assessing any trading opportunity.
When you see high volume, this means bulls and bears are fighting against one other for market dominance. Once one side prevails, the trend will likely follow in their desired direction. Therefore, if there is strong volume in conjunction with a Fibonacci extension breakout, this gives us further validation of our trading signal.
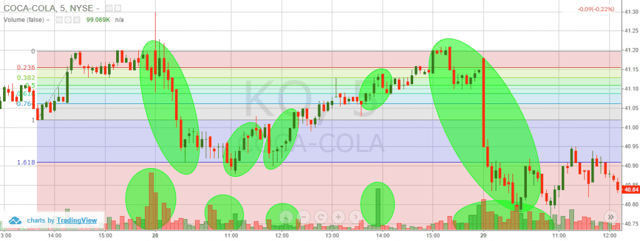
Fibonacci Extensions + Volume
This is the 5-minute chart of Coca-Cola from May 27-29, 2015. I have placed a Fibonacci retracement on a small bullish trend in the upper left corner. At the bottom of the chart, you will see the volume Indicator. The chart and the volume indicator show four examples of price moves due to high volume.
The first case is when the price approaches the 0% Fibonacci retracement level for the third time. Volume increases and the price drops quickly to the 1.618% extension level. Coca-Cola finds support, volume increases and the price starts to move in a bullish fashion.
When KO reaches the 0% retracement again, volume begins to increase to the downside. This time Coca-Cola was able to break the 1.618% retracement level to the downside. Therefore, where the 1.618% was previously support, this level will now act as resistance once breached.
Which Fibonacci Extension Trading Strategy is the best?
I believe the KST is the most straightforward approach out of the three day trading strategies covered in this article. The signals are crystal-clear and if you want extra confirmation, you can add volume into the mix.
Thus, the best strategy is combining Fibonacci extensions, KST and the volume indicator.
In Summary
Fibonacci Levels act as standard support or resistance levels.
Fibonacci extensions are the levels, which go beyond 100% Fibonacci retracement.
In order to determine Fibonacci extensions, you should identify a trend with a corrective move.
If price reaches a Fibonacci extension level, we need to confirm subsequent moves with another instrument.
Some of the useful tools for trading Fibonacci extensions are:
Awesome Oscillator
Know Sure Thing Indicator
Volume Indicator
I believe the most useful way to trade Fibonacci extensions is by combining the KST indicator with the volume indicator.
Tags:
About the Author
Al Hill
Co-Founder & CEO, TradingSim
Alton Hill is the Co-Founder of TradingSim with over 18 years of trading experience. He completed the Design Thinking Bootcamp at Stanford’s D.School and brings expertise in Product Development to create the best trading simulation experience. His strategy focuses on trend-following systems, targeting high-volatility stocks with strong primary trends using the 15-minute chart.
What are the Fibonacci sequence and the Golden ratio? A Fibonacci sequence is a number pattern that was discovered and introduced in the 13th century by the Italian mathematician Leonardo of Pisa,...
Fibonacci Arc Definition Fibonacci arc is a technical analysis indicator used to provide hidden support and resistance levels for a security. A Fibonacci arc is constructed by first drawing a trend...
Three Fibonacci Trading Strategies + Infographic & Video [Updated April 2026]
At times it feels like traders give the Fibonacci trading sequence an almost mystical power. Yet, despite its mysterious accuracy in trading and in nature, Fibonacci is nothing more than simple...


 Day Trading Indicators


