A Fibonacci arc is constructed by first drawing a trend line between two swing points on a chart. These two points should be between a clear peak and trough on the chart. Once the line is drawn, key Fibonacci levels are placed on the chart at 38.2%, 50%, and 61.8% retracement levels. An arch is then drawn at each respective level to generate the arching angles on the price chart. Read more to learn how to use a Fibonacci arc.
Fibonacci arc trading is done by first identifying the key Fibonacci arc levels. The next step is to monitor how the stock performs at these key levels. If the stock breaks above both a recent price high and an arc resistance level (38.2%, 50% or 61.8%), a buy order should be placed. Traders should then look for the next highest Fibonacci arc level to lock in profits, or sell the position outright.
Another popular method when Fibonacci arc trading is to look for a failure at Fibonacci arc levels. Since arc levels are not followed by many traders, these are considered “hidden” levels on the chart. For example, a trader can wait for a break above the 61.8% retracement level and then close back above the arc. A short position should be entered after a move below this reversal bar.
Below is a Fibonacci arc trading example, courtesy of VT Trader. This example is on a 30-minute level over a two-day period. Notice how a trough and peak are used on the chart to draw the trend line which the Fibonacci arcs are based upon. Then notice how as the price reacts from the peak it sells off sharply down to the 61.8% arc retracement level. This hidden arch level initially acted as support, but as the EUR/USD closed below the arc level, it eventually became resistance.
One thing to remember about drawing fibonacci arcs is that it is based on the scale of your chart. So, if a trader is using a logarithmic scale the arcs will look differently than on linear. This is because the arcs will be extended differently as a result of the logarithmic scale because the price is weighted and will change as the chart moves out in the future. Whereas a linear chart will simply reflect the price movement in a straight line fashion.
Fibonacci Arcs Trading Approach
Now that you are familiar with Fibonacci arcs, we will now dig further into how to trade with the indicator.
After all, it is not enough to identify patterns on the chart. You should also know how to enter and exit trades based on signals from the indicator.
Entering Trades – Fibonacci Arcs
There are two types of price moves, which you can attempt to catch with the Fibonacci arcs tool. These are price moves in the direction of the trend and price moves against the trend.
Trading Fibonacci Arc Breakouts against the Trend
fibonacci arc
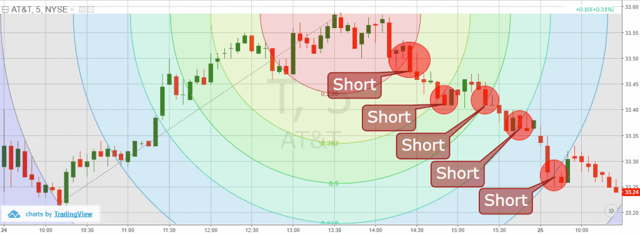
The chart above is of a bullish trend that enters a reversal phase.
You will want to use the high and low of this pattern to create the Fibonacci arcs.
On the way down, the price action breaks the 23.6%, 38.2%, 50.0%, and 61.8% Fibonacci arcs. See that after each breakout in the arcs the price decreases further. Each of these breakouts gives you an opportunity to trade against the primary trend.
As you can see, this method would have worked all the way down as the stock ultimately retraced the entire move.
Trading Bounces using Fibonacci Arcs
This trading practice involves trade entries after the price bounces from one of the arcs in the direction of the trend. Imagine the price breaks a trend and goes to one of the Fibonacci arcs. If you see the price bouncing from the arc, you should trade the stock in the direction of the bounce.
Pullback Trade – Fibonacci Arc
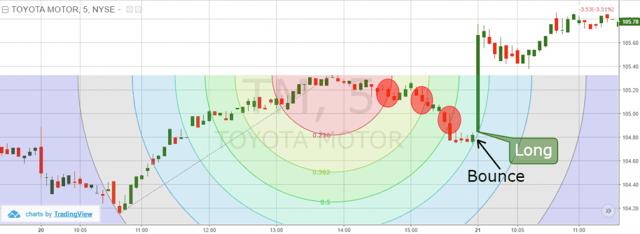
Above is a classic example of a price bounce from a Fibonacci Arc.
Again, we use the high and low of the pattern to create the Fibonacci arcs.
The price starts decreasing and it breaks the 23.6%, 38.2% and 50.0% Fibonacci arcs. Then suddenly the price action touches the 61.8% arc and creates a small bullish candle, indicating a bounce.
We use this bounce as an opportunity to enter the market and place a long trade.
As you see, the price finds support at the 61.8% arc. The stock then begins to resume its bullish move higher.
Stop Loss – Fibonacci Arcs Trading
You should always protect your trades with a stop loss, regarding of the method. This same rule applies to Fibonacci arcs – no exceptions. After all, the market will not always move in your favor.
Therefore, you should never let the market surprise you.
Since there are two types of entries when Fibonacci arc trading, we will approach two types of stop-loss order positioning.
Stop Loss – Fibonacci Arc Breakouts
When you see the price breaking a Fibonacci arc, you are supposed to enter the market in the direction of the breakout. In this manner, you are trading against the previous trend.
To position your stop loss, you should pick a price peak, which is located somewhere above the broken arc.
Let’s walk through a real-life example, to clarify the placement of the stop-loss order.
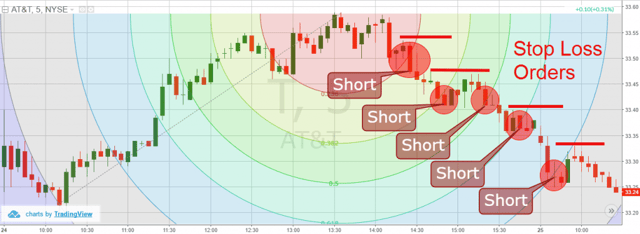
Fibonacci Arc – Stop Loss
The red horizontal lines on the image represent the proper location of the stop-loss orders on these potential trades. See that the second and the third trade share the same level for a stop-loss order. The reason for this is the weak downward move after the second short signal.
The bottom line is that you are protecting your gains as the stock moves higher in your favor. This my friend is how you make money in the market.
Stop Loss – Fibonacci Arcs Bounces
This time we will position the stop-loss orders beyond the levels, which the price bounced off the Fibonacci arc.
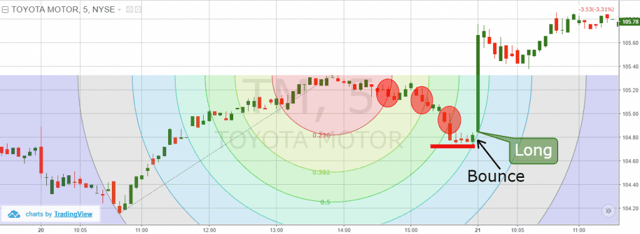
Fibonacci Arc – Stop Loss for Bounce Trades
Above you see the bounce from the 61.8% Fibonacci arc we discussed a couple examples ago. The red horizontal line represents the proper location for your stop-loss order. See that we use the small range, which the price creates in the time before the bounce. If the price decreases to this level, it will definitely be outside the 61.8% arc.
Profit Taking – Fibonacci Arcs
Scalping for Moves between the Arcs
This profit approach includes trading the price moves from arc to arc. No matter if the price has broken, or bounced from an arc, you should stay in a trade until the price reaches the next arc.
For example, if the price breaks through the 23.6% Fibonacci arc, you should open a trade and stay in the position until the price touches the 38.2% arc.
Trading until the Stock is Trending in Your Favor
Some traders are very flexible on their profit-taking approach and like to let the stock run in their favor. In this manner, they prefer to stay in the trade until they receive a contrary trading signal from the stock.
After all, why exit a trade, which is going more and more in your favor?
This means you essentially ride the wave until the price goes against you.
While this approach will yield the largest gains, the success rate will be relatively lower.
This is because the price will likely reverse at some point and retest your entry. As a responsible trader, you will need to determine which profit-taking approach works best for your personality.
I prefer to go with the a high winning percentage.
This is because I am a sore loser and I still get upset when things do not go my way. Similar to the way I felt when I was 5 years old and my brother would beat me in a game.
Hey, don’t judge me; I am what I am.
Trading Strategy – Fibonacci Arcs
We will now combine the rules we discussed above into a complete Fibonacci arcs trading system.
Fibonacci Arc – Trading Strategy
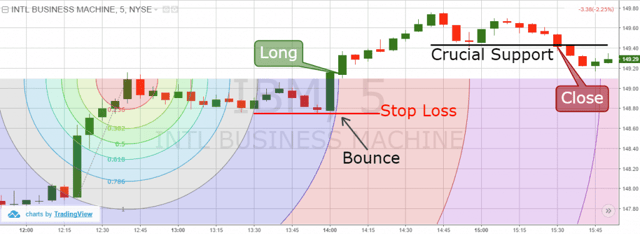
Above you see the 5-minute chart of IBM from Mar 29, 2016.
We first anchor our Fibonacci arcs based on the high and low of the range.
See that the price starts moving sideways after reaching a swing high.
The range brings the price through almost all the arcs on the chart. However, this ends when the price reaches the 161.8% Fibonacci extension arc. After touching this arc, the price bounces upwards directly above the 100% Fibonacci level.
We get a nice signal for a long position and we buy IBM. The stop loss should be located right below the bounce, which is also the lower level of the previous price range.
The price continues its increase after we enter the market. An hour later, the price creates a top and begins a minor correction. Then we see another bullish bounce and the creation of a lower top on the chart.
This lower top is the first indication that the bullish move might reverse. The stock then goes into a small range and creates a clear support area.
After creating the lower top, the price decreases through the support level and we close our long IBM trade.
Now let’s review a Fibonacci arc trade with a bearish trend.
Fibonacci Arc – Stop Loss Example
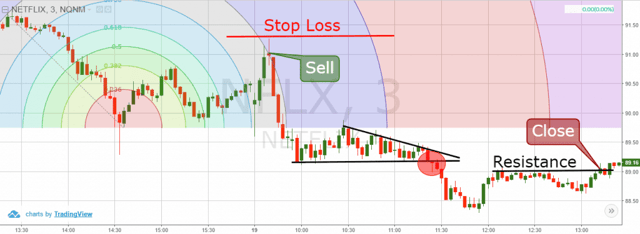
You are now looking at the 3-minute chart of Netflix from May 19, 2016. The chart begins with a bearish trend, which we use to position our Fibonacci arc indicator.
After the price finishes the bearish impulsive move, it starts a consolidation, which begins to produce higher highs. The first bullish impulse leads the price action to the 50.0% Fibonacci arc. The price then bounces upwards and reaches the 100% Fibonacci level.
However, this is not the important price move. The second bullish impulse brings the price to the 161.8% Fibonacci extension arc and creates a little bearish bounce. This is the right moment to sell NFLX.
As you see, the price starts a rapid decrease, which goes below the 100% Fibonacci level. Then the price enters a consolidation phase. As you see, the consolidation resembles a triangle, where the lower level is flat. The tops of the consolidation are lower. In this manner, the triangle breaks downwards and we keep our short trade.
The price decrease continues to $88.30 per share, when suddenly the downward move halts and a trading range ensues.
We mark the upper level of the consolidation with a resistance area as shown on the image above. The further price action crawls right below this resistance level.
Netflix attempts another bearish move, which proves unsuccessful. The price returns to the resistance and breaks to the upside. This is the ultimate exit signal and we close our short position with Netflix.
Conclusion
- The Fibonacci Arcs indicator is used to find hidden support and resistance levels on the chart.
- It has the same levels as the other fibonacci tools (extensions, retracements, etc.)– 26.3%, 38.2%, 50.0, 61.8%, etc.
- When you use the Fibonacci arcs you can take two types of trades:
- Arc Breakouts
- Arc Bounces
- When you trade arc breakouts, you should enter the market in the direction of the arc breakout. In this case, you should place a stop beyond a crucial peak created in the time of the breakout.
- When you trade arc bounces, you should enter the market in the direction of the bounce. In this case you should place a stop loss beyond the peak, which is being created with the bounce.
- You have two take profit options when you trade Fibonacci arcs:
- The first one is to scalp the stock when it reaches the next Fibonacci arc. Traders open and exit trades from arc to an arc, hopping in and out of the market. This Fibonacci arc strategy has a high success rate, but the gains are relatively small.
- The second method is to trade the stock until it stops trending in your favor. This technique involves the usage of simple price action techniques. If you implement this profit-taking strategy, your Fibonacci arc success rate will be relatively low; however, the profit from each trade will be much higher relative to scalping.


