The fan principle is based on the use of multiple trend lines to judge a major reversal in the market. The fan principle on first glance looks very busy on the chart, but it can provide some clarity to otherwise choppy patterns. The fan pattern or principle gets its name because it resembles a “fan”. It should have a minimum of three trend lines, which contain the price movement. The origin of the trend lines should come from a significant peak or trough.
How to Construct the Fan Principle
Have you ever had a stock breakout of a trend line only to back test the line? Then after the second breakout, it back tests the second breakout line. This process will wear you out and make it tough to stick to your trading guns. This is a simple of enough concept right? Well, what the fan principle provides you is a way to assess this struggle between supply and demand and to uncover the “true breakout”, so you can go counter to the primary trend. The key to a good fan pattern is that the trend lines are clean and truly contain the price pattern. Another thing to look for is that there is equal distance and our slope of angle between each line.
How to Trade the Fan Principle
Since the fan principle is comprised of three trend lines, you will want to buy the break of the third trend line. By the time the third break occurs, the fan pattern has confirmed the breakout.
Fan Principle Chart Example
Remember that the break of the third trend line is usually the indication of trend reversal.

Fan Principle Chart Example
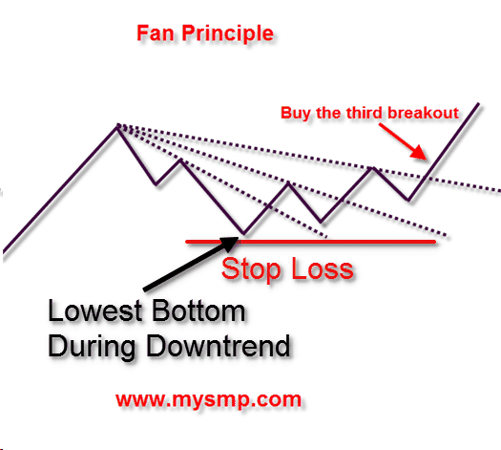
The three Fan levels are displayed by the dotted lines on the sketch. The image shows a price decrease, which reverses through the three arcs of the Fan.
Each of these levels works as support or resistance.
See that each of these levels formed by two price tops, starting from the beginning of the downtrend.
Each top-of-the-price action in combination with the first high creates the next fan level. When the price breaks the first fan level, it then has a correction to the same level in order to test it as a support. It works the same way with the other two fan levels.
When you discover this pattern on the chart you will have the opportunity to trade in the direction of the fan breakouts after the price breaks the third fan level.
This is the ultimate position trigger of the fan. When you see a stock going through the third level of the indicator, there is a big chance that the price continues with a further extension as shown on the sketch.
Fan Trading Strategy
Tip #1 – Confirming the Fan Chart Pattern
The fan pattern confirmation starts by identifying the three fan levels on the chart.
This starts when the first level goes through the second and then ends up with the creation of the third fan level. When you have all three fan trend lines, then you have a potential fan trading pattern.
However, this is not enough in order to confirm the pattern. The real confirmation of the fan indicator comes when the price breaks the third trend line. In this manner, any actions related to the fan trading should be taken after the price goes through the third fan trend line.
Tip #2 – Entering a Fan Pattern Trade
As you probably think, the fan trade entry comes after the price action breaks the third trend. However, the trade you take should be long or short depending on the direction of the price movement.
- Long Fan Trade: The sketch we discussed above is a classical long fan trade example. The price was decreasing initially, then the price action created the first and second top above the initial bearish trend. These two tops formed the second and third trend line. Hence, a bullish break through the third fan trend would trigger a long trade.
- Short Fan Trade: Now let’s say that the trend we are reviewing is bullish. The short trade entry develops when the price action breaks the third fan level downwards.
Tip #3 – Fan Trading Stop Loss
You should always protect your fan trades with a stop loss order.
The best location of your fan stop loss is below the lowest bottom of your trend – in case of a bearish trend and a bullish fan respectively. If the trend is bullish and the fan is bearish, then the right place of your stop is above the highest top of the trend.

Fan Principle – Stop Loss
You are looking at the same fan trading sketch. This time, I have included a stop loss in the image – the lowest low of the downtrend. It works the same way with a bearish fan indicator, but in the opposite direction.
Tip #4 – Profit Targets with the Fan Trading Indicator
When you trade with the fan, you should be prepared for a holding your position.
This is because the fan is used to identify major trend reversals.
You will need to carefully follow the price action and pivot point breakouts. If you see the stock breaking a crucial level on the chart in the opposite direction to your trade, then this might be the right moment to close the trade.
Trading with the Fan Indicator
Now that we discussed the parameters of the fan trading indicator, I will now show you this trend reversal tool in action.
We will enter trades after the price breaks the third fan level and we will place the stop loss below the lowest bottom (or above the highest top) of the trend. At the same time, we will stay in the trades until the price starts to move in the direction of the primary trend. Have a look at the example below, which displays a fan trading example:
Fan Indicator – Trading Strategy
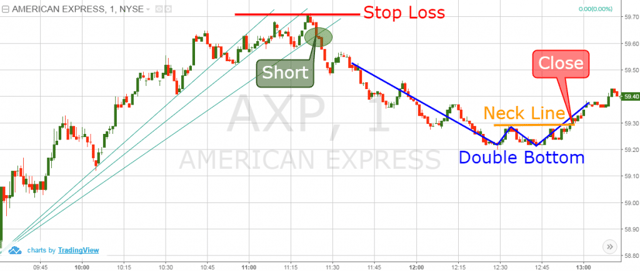
Above is the 1-minute chart of American Express from March 16, 2016. The image begins with a strong bullish trend, which loses its intensity, creating weaker bottoms. We use these bottoms to build the fan on the chart which consists of the three bullish trend lines (green).
The price initially breaks its trend (the first line) creating a bottom outside of the primary trend. We use this bottom and the beginning of the overall bullish trend in order to draw the second trend on the chart.
However, after a short break of the second trend, the AXP stock breaks it downwards and creates a bottom outside. We take this bottom and the beginning of the general bullish trend in order to build the third fan level on the chart.
Now we have a complete fan indicator on our graph! The confirmation of the pattern comes when the price breaks the third trend line in bearish direction. This breakout signalizes that a major reversal of the bullish trend might be on its way. Therefore, we use the breakout to short AXP.
After we sell American Express we place a stop loss right above the highest point of the trend. The right location of the stop loss is shown with a red horizontal line on the chart.
As you see, the price enters a strong bearish trend after we short AXP. The price action produces lower tops and lower bottoms, which is an indication of a strong bearish trend.
Then suddenly the chart prints a double bottom.
The orange horizontal line on the chart is the neck line of the pattern. When the price breaks this line upwards, this is a signal that the price might increase at least the size of the double bottom formation.
Since this is a nice premise for the formation of a bullish move, it is better to abandon the trade when the price goes through the orange neck line.
The interesting thing about this trading example is that the end of the first trade generates the beginning of the second one.
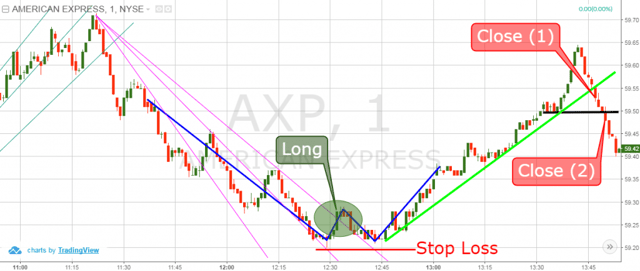
Fan Indicator – long and short trading example
We are looking at the same American Express chart, but after one hour of progress. The pink lines on the chart are the three fan trend lines. Each of these lines is built by taking the beginning of the trend and each successive top.
Finally, the price action goes above the third pink trend line, which is the confirmation of the Fan trading pattern.
We use this signal to go long.
Notice that this signal comes before the confirmation of the double bottom chart pattern (blue). In this manner, we can use the confirmation of this fan (pink) as an early exit from the previous trade of the green fan.
The stop loss in this trade should be located right below the double bottom pattern. The reason for this is that the two bottoms of the pattern are the lowest points of the bearish trend.
After we go long, American Express goes on a bullish run.
The increase is relatively strong and the price creates minimal corrections on the way up.
Since our profit taking strategy is based on pure price action, we build a bullish trend line on the chart (green).
The price has four bottoms on the trend line before it starts an exponential increase. After topping out at $59.60, the price begins a bearish move, which breaks the green trend.
This is the first exit signal we get on the chart, which we can use to close our trade.
However, if this signal is not enough for you, you can wait for the price to break support. This level is marked by a black horizontal line on the chart. If you don’t use the first close on the chart, then you might want to use the second one.
Conclusion
- The fan trading indicator is used to predict major reversals on the chart.
- The fan indicator name comes from its structure, which resembles a blowing fan.
- The fan indicator is built by placing three trends one above (below) other according to the tops (or bottoms) on the chart.
- The fan indicator is present after the creation of the third trend on the chart.
- The actual fan pattern confirmation comes with the breakout through the third trend.
- When the third trend of the fan is broken, we get an entry signal in the direction of the breakout.
- There are two types of fans:
- If the trend used is bearish then the fan is bullish.
- If the used trend is bullish, then the fan is bearish.
- When you enter a fan trade you should always use a stop loss.
- When the trend is bearish and the fan is bullish, you should place a stop below the lowest point of the bearish trend.
- When the trend is bullish and the fan is bearish, the stop should be located above the highest point of the Fan.
- One of the best ways to take profit when trading fans on the chart is by using price action techniques. Close your fan trade when the price breaks a trend, or a crucial support. Also, watch out for reversal chart patterns on the graph.


 Day Trading Indicators


