The Dow futures (YM) and the S&P500 futures (ES), along with the Nasdaq100 futures (NQ) are the three biggest and popular futures trading instruments for day traders. You might want to add the Russell 2000 futures (ER) into that list as well.
With so many different index futures available, a futures day trader could no doubt be left wondering as to which of these four index futures makes for the most ideal instrument to trade. The common factor behind all these four types of index futures is that they track a broad set of stocks in the US equity markets. However, on closer observation there are technical differences that can become the primary factor between a successful and a disastrous trade.
With the Dow and S&P futures being the most widely traded index futures and followed closely, the question is which of these two make for a better fit for traders.
In this article we take a look at the differences between the Dow and the S&P500 futures so that you can make an informed decision on which of these two index futures are more ideally suited to your trading profile.
What are Dow Futures?
Dow futures contracts track the underlying asset, which is the Dow Jones industrial average. The DJIA or the Dow 30 tracks the thirty publicly listed companies on the US stock markets. It is the second oldest stock index (since 1896) and was named after the founder, Charles Dow of the Dow Jones & Company. The Dow index is currently owned by the S&P Dow Jones indices. Since its inception however, the 30 listed companies have changed and the name “industrial” doesn’t need to be taken literally.
The most important aspect of the Dow Jones Industrial average is that the 30 components or the companies listed on the stock are price weighted. Price weighted means that a component with a higher stock price is given more weightage than a component with a lower stock price.
Below are the 30 companies currently listed on the Dow Jones Industrial Average.
| Goldman Sachs |
McDonalds |
Disney |
Dupont |
Verizon Comm. |
| 3M |
Travelers |
Caterpillar |
American Express |
Coca-Cola |
| UnitedHealth Group |
Chevron |
Exxon Mobil |
Walmart |
Intel |
| IBM |
Johnson & Johnson |
Procter & Gamble |
Merck |
Pfizer |
| Boeing |
Apple |
JPMorgan Chase |
Microsoft |
GE |
| Home Depot |
United Technologies |
Visa A |
Nike B |
Cisco Systems |
The Dow Futures merely tracks the index performance of the combined 30 companies listed and the Dow Index is considered to be a bell-weather of the US economy.
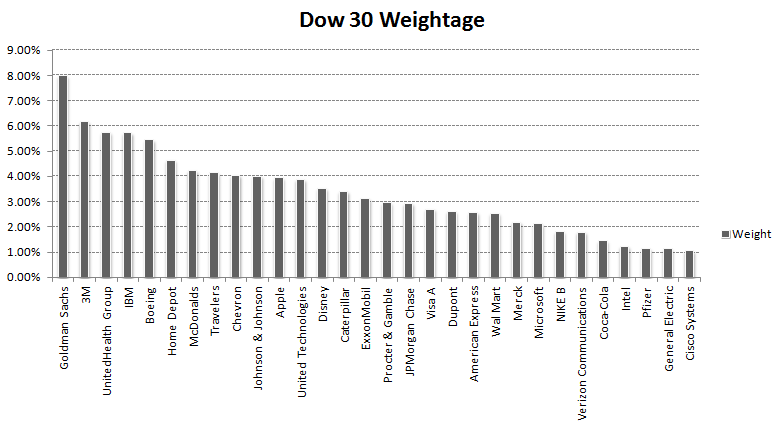
Dow 30 Industrial Average, Company by weight age
The weightage chart shows that for example, Goldman Sachs has a strong influence on the Dow, with the weightage of nearly 8%. On the other hand, the same stock has an approximate weightage of just 0.45% in the S&P500 index.
One of the main benefits of trading the Dow futures is that it offers a built in leverage which allows day traders to make significant gains on the price volatility. The Dow futures come with a multiplier of 10, meaning that it offers a leverage of 1-10. In other words, the standard Dow futures contract controls 10 times the actual price value. So, if the Dow futures contract was trading at 18000, then a single futures contract has a market value of 180,000. A one-dollar move in the Dow would result in a $10 increase or a decrease.
Besides the standard Dow futures, traders can also access the mini-sized Dow futures contract, which has a multiplier of 5 and is often referred to as the $5-dow futures contract. As the name suggests, the mini-sized Dow futures has a $5 value for a 1 point move in the Dow index, which is exactly half of the standard Dow futures. Therefore, if the Dow futures contract was trading at 18000, the mini-sized Dow futures contract controls 90,000. With a multiplier of 5, one point move results in a $5 increase or decrease in price.
To put it differently, if the Dow moved 100 points, then the standard Dow futures would result in $1000 profit or loss, while a $5 mini-sized Dow futures results in a $500 profit or loss. Besides the $10 and $5 Dow futures contract, there is also a larger contract with a multiplier of $25. Among the three, the $10 and the %5 Dow futures contract make up for the most popular with the $5 mini-sized Dow futures being the most popular.
Trading Volume Comparison of Dow and S&P500 futures
There are many factors that can determine the answer to this question such as, your trading capital, your risk tolerance as well as the technical aspects of spread, the dollar value per tick and so on. While there are many articles that talk on the pros and cons of trading one of the two index futures, the truth is that there is no best index futures contract that you can trade. If that were the case, it would easily reflect on the trading volumes from the exchange for a particular index futures contract.
The chart below shows a comparison of the trading volumes between the E-mini S&P500 futures (ES) and the Dow futures (YM). You can see that the trading volumes for the S&P500 futures are 10 times those of the Dow.
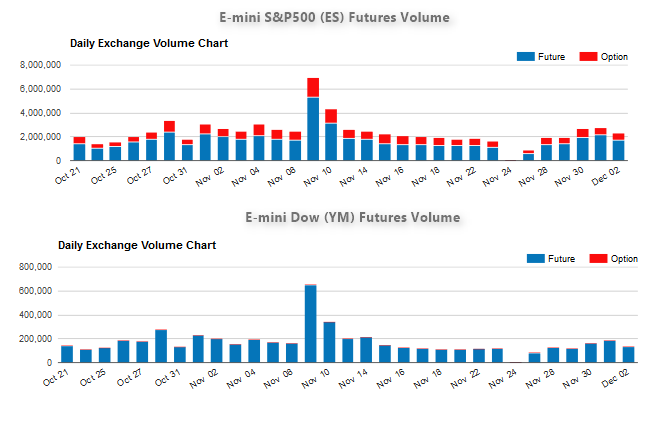
SP500 vs Dow Futures Trading Volume Comparison
Contract comparisons for Dow and S&P500 futures
Comparing the contract specifications for the Dow and the S&P500 futures can be a good way to get an insight into the requirements and the potential for trading these contracts and even help traders to figure out which of these two index futures is more ideal.
| Ticker |
ES |
YM |
| Tick Size |
0.25 |
1.00 |
| Tick Value |
$12.50 |
$5.00 |
| Dollar value |
$50 (ex:2100 -> 2101) |
$500 (ex: 18000 -> 18100) |
| Expiry Months |
Mar (H), June (M), Sep (U), Dec (Z) |
Mar (H), June (M), Sep (U), Dec (Z) |
Spread comparison for Dow and S&P500 futures
When attempting to understand if the Dow futures or the S&P500 futures are more suited for your day trading, comparing the spreads can be an important factor that can influence your decision.
The chart below shows a comparison of the Dow and the S&P500 futures chart. You can see that the spread is 5 points for the Dow futures and 0.25 points for the S&P500 futures. This translates to $25 in spread that you need to pay when trading the Dow futures, while for the S&P500; the spread is only $12.50.
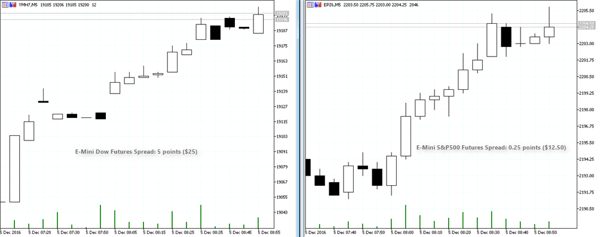
Dow vs SP500 Futures Spread Comparison
It might seem that the S&P500 futures are less expensive contracts to trade compared to the Dow. To get a better idea of the trading volatility between the two instruments, if you apply the ATR on the daily chart, the average range for the Dow futures is about 80 points, while for the S&P500 futures; the average range is 12.50 points. In dollar value, this amounts to $400 and $625.
It is easy to see that the S&P500 futures (mini-sized) contracts so far has a tighter spread and also the intraday range offers more value compared to the Dow futures.
In terms of the day trading margins, both the Dow and the S&P500 futures contracts have almost similar margin requirements. On average, the initial margin required to trade the Dow futures is about $500, while the initial margin requirements to day trade the S&P500 futures is about $400.
Trading Dow Futures or the S&P500 Futures?
With the above information, a futures day trader should be able to figure out which of these two stock index futures are more suited for their trading, which comes down to checking with your trading strategy, risk management style, trading capital, among other things will compliment one of the two stock index futures.
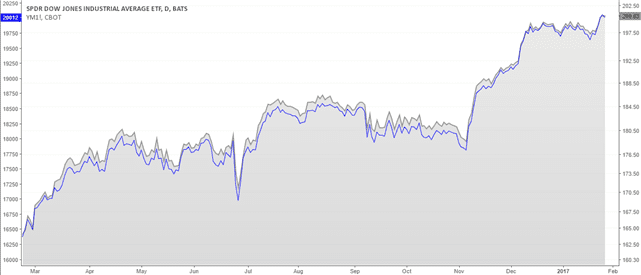
No matter which of the two futures that you choose to trade, you can always refer to both the Dow futures chart and the S&P500 futures chart as both the indexes are nearly correlated, perhaps with a certain degree of lag.
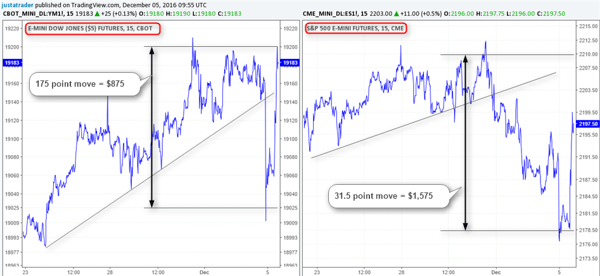
Dow Futures Chart vs SP500 Futures Chart
The above chart shows a side by side comparison of the Dow futures and the S&P500 futures price chart. You can see as an example that on an intraday basis, a 175 point move in the Dow futures chart results in a dollar equivalent value of $875. On the other hand a similar move in the S&P500 futures chart as a 31.5 points price movement, which at a rate of $50 per point results in $1,575.
It is evident that trading the S&P500 futures contracts (mini-sized) can yield bigger returns but also comes with higher risks. On the other hand, the price movement in the Dow is relatively smaller both in terms of the point move and the dollar value of the price movement on the charts.
Traders should also consider the fact that in terms of sector weightage, the Dow Jones leans 20% to the financials with industrials coming in at a close 19%. On the smaller end of the scale, telecommunications, basic materials, and consumer goods have a weighting of 1.79%, 2.64% and 6.19% respectively. This weightage is more evened out in the case of the S&P500 index where interestingly the weightage is more towards Information Technology, healthcare and then financials.
The bottom line being that it is basically up to the trade on which of these two contracts are more preferable to trade. Still, regardless of which of the two stock index futures contracts you want to trade, it helps to keep an eye on the price charts for both the Dow futures and the S&P500 futures as they tend to correlate to each other most of the time. There is no doubt that the Dow Jones industrial average is the widely watched index as far as the US equities are concerned.
However, the fact that it tracks only 30 components or stocks makes it vulnerable to exaggerated price movements on a single heavily weighted component such as Goldman Sachs (GS) stocks having a close to 8% weightage on the index which can shift the index on domestic issues concerning just that one particular stock.
At the end of day it is all about how comfortable a futures trader is that matters. Therefore, take time to test out both the futures contracts to see whether the Dow futures or the S&P500 futures are more suited to your trading profile.


 Commodity Futures


