Price and volume are the oldest indicators you will find in the market. As day traders we are always looking for an edge, hence the endless supply of indicators and trading methodologies. When you really boil it down to its root, trading is nothing more than capitalizing on the imbalance of supply and demand. So, if your screen is cluttered with a bunch of indicators all saying different things and you feel completely lost, then you have landed in the right place. In this article we will cover the day trading strategy of how to effectively use divergences with price and volume to beat the market.
What to look for with Price and Volume
- As price moves in the direction of the primary trend, volume should accompany the security with each successive new peak (bull market) or trough (bear market).
- Each counter move to the primary trend should do so with lighter volume
- Once the volume for a counter move matches or exceeds the last swing high or swing low of the primary trend, this is a clear sign a potential reversal is in play
- Just to confuse you a little, there is one exception to the above rules. For example, if you are in a bear market with a clear down trend line that contains each rally it is ok for each successive touch of the trend line to have heavy volume, as long as this is a sign of selling pressure. Meaning as the stock hits the down trend line and then moves lower, volume should pick up as sellers short the stock and weak longs use it as an opportunity to unload their shares.
Confirming Primary Trend
An oldie but goodie for traders to identify the primary trend is to overlay one of the many moving averages over the price chart. What if you could use an off chart indicator to do the same thing, but with more confidence. The problem with moving averages is you will get out of the trade when the stock has closed below the moving average. What if you could know going into a rally that it’s time to sell on any weakness. Instead of using a lagging indicator such as simple moving averages, you can use volume as a leading indicator.

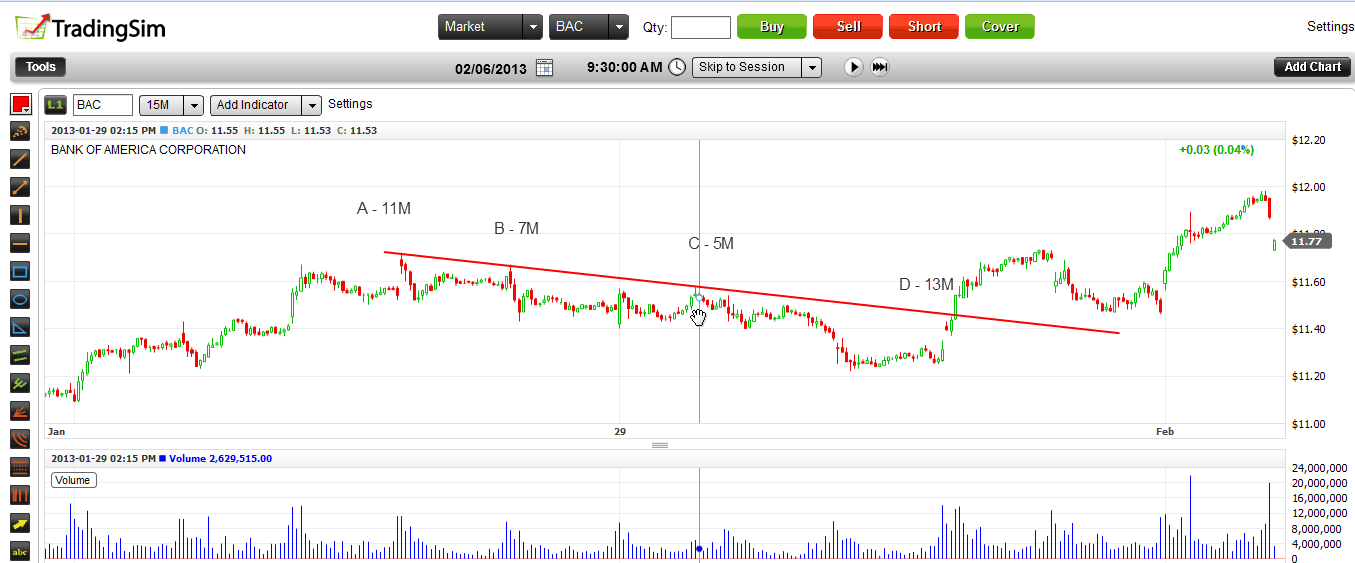
In the above example of Bank of America (BAC) from 1/28/2013 and 1/29/2013 you can clearly see the stock has an established down trend on the 15-minute chart. In point A above the high was made with 11M shares traded. Then as you can see points B and C both were made with lighter volume. Finally point D had an almost 200% increase in volume. So, how would you trade this setup? Point A and B are purely points that you observe since these establish the downward sloping trend line. Point C would have been your first opportunity to short BAC. You would want to see how the volume comes in on the candlestick and where it closes before you open a position. After point C the stock began to slowly rollover and the volume began to pickup as the stock went lower. At point C At point D, there are a couple of triggers that would have prompted you to exit the trade if you hadn’t already. (1) BAC closed above the down trend line and (2) the volume was significantly higher on the breakout candlestick.
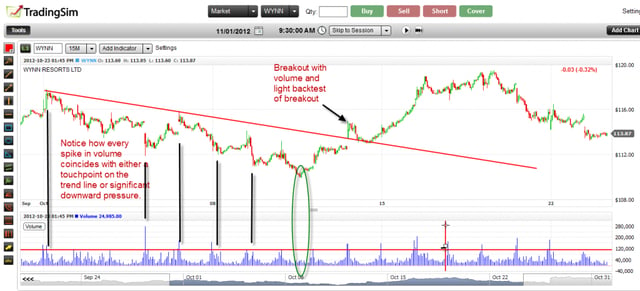
The above Wynn Resorts (WYNN) trade from early October 2012 illustrates how price and volume can tell a story as the stock fluctuates between highs and lows. You will notice on the left side of the above chart WYNN was experiencing heavy volume as the stock (1) tested the down trend line or (2) dipped into a swing low. The low and volume which has a green circle around the action is the first time in this down move where the volume began to dry up. This would have been your trigger if you were long to either book profits or tighten your stops. The stock then went flat for and ultimately jumped the trend line on heavy volume. Assuming you exited the short trade when the stock started to drop on lower volume, now would be the time to load up once the stock pulled back to the trend line. This was safe entry since the stock pulled back on light volume. You would have received confirmation on the trade once you saw it break the most recent high with high volume. This shot the stock up from the $113s all the way up to $118.98 by 11:15 am.
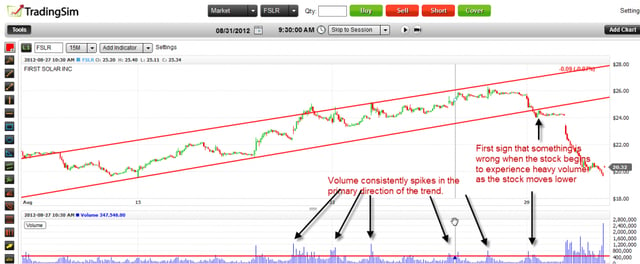
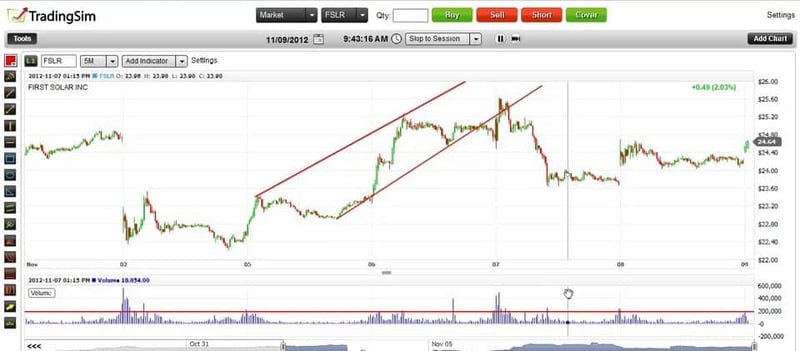
In our last example we will be looking at FSLR from August 2012. The stock was in a clearly defined up channel. As the stock made higher highs within the channel, this price action was also accompanied with high volume. This pattern held true on the 15-minute chart for over a week. You could have bought the pullbacks and quietly rode the stock higher. As you can see from the chart above FSLR finally broke down through the support line and then followed this break with a sharp gap down. Well was that gap down really a surprise? Of course not, the smart money’s intentions were clear in the tape. As you can see when the stock broke through the bottom trend line it did so with increased volume. After the break the stock drifted sideways or as we call it in the trading world developed a bear flag. If you were day trading FSLR you would have had about 5 hours after the break of the trend line to exit the trade.
Pros
If you use price and volume it reduces the noise of the market. Instead of reacting to every down day as if it’s the end of the world, this will allow you to put things into perspective. You will know that while your stock may have pulled back, if it did so on 80% less volume, the primary uptrend is likely to continue. You will also be able to anticipate when a strong market has weakened. So, in the future you will be able to spot the weakness exhibited by FSLR in our previous example prior to the gap down.
Cons
Analyzing price and volume while day trading requires you to make quick decisions. Problem with this method is unlike other indicators that may hit a certain overbought or oversold level on an indicator, you have to review and assess price and volume action quickly and accurately. Again, price and volume is very subjective, so it’s not an trading methodology for the newbie trader.


 Day Trading Indicators


