As a day trader, a common question asked is should you trade daily charts?
The root of the question comes down to the fact you are trading intraday, so why care about what’s happening on higher timeframes?
In this article, we will explore many aspects of day trading with daily charts to see if it’s a good fit for you.
Using Daily Charts Can Simplify Things
Please do not interpret "simplify" as easy.
What I mean by this is that by going to a higher timeframe, the chart does not give you as many signals. Let’s dive into three trading setups utilizing daily charts to further illustrate this point.
#1- Normal Daily Buying and Selling Opportunities
There are going to be those of you that like to day trade normal buying and selling opportunities. These are trades that set up on the daily bar, but there isn’t necessarily anything special about the price action.
It comes down to an opportunity displaying itself on a day trading daily chart and you go along for the ride.
Long and Short Trades
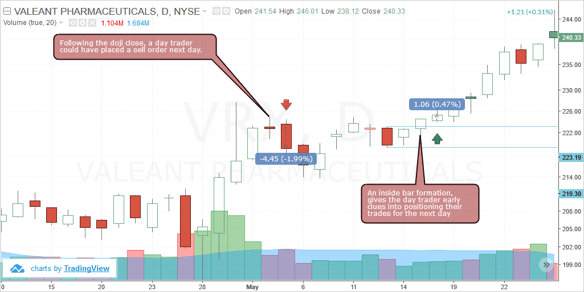
Below are two examples of a short and a long trade based on price action and technical analysis.
The point is that you don’t fire and forget after making your trade, but the daily chart gives you a clue that traders on a higher timeframe are taking a position.
For example, in the below chart where you see a short signal, this doesn’t mean you sell short and hold.
What it means is that if you are going to trade the stock, you should take a short position. Conversely, the next trading opportunity is a long after a breakout of the inside bar.
Again, you will still need to do the hard work of looking at the charts on an intraday timeframe.
Day trading on the daily chart time frame
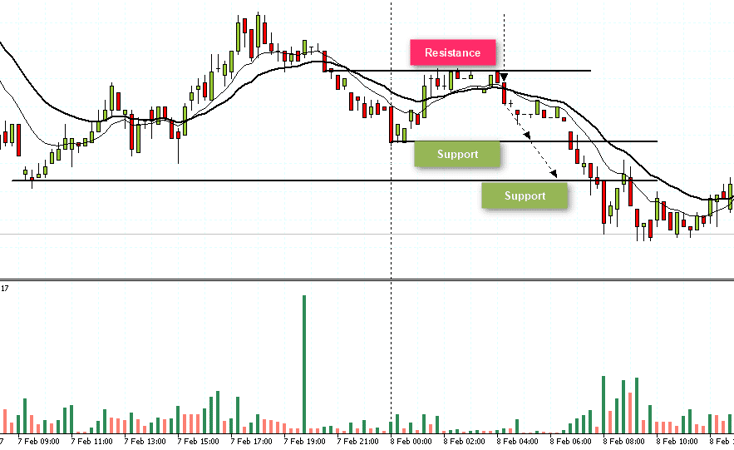
#2 – 52-Week Highs/Lows
Another simple approach for trading daily charts is to look for new 52-week highs or lows.
For example, if a stock makes a new 52-week high this is a prime opportunity to get long.
Now swing traders may look at this as an opportunity to buy and hold. As a day trader, you can alternatively look to buy the breakout in the morning and hold it through lunch.
This way you can capture the bulk of the move on the breakout day, but not be committed to holding the stock for weeks or months.
#3 – First Big Green/Red Day
In this trading example, you want to identify the first big green or red day.
If it’s a big green day, you will want to get long the stock. If it’s red you will want to get short.
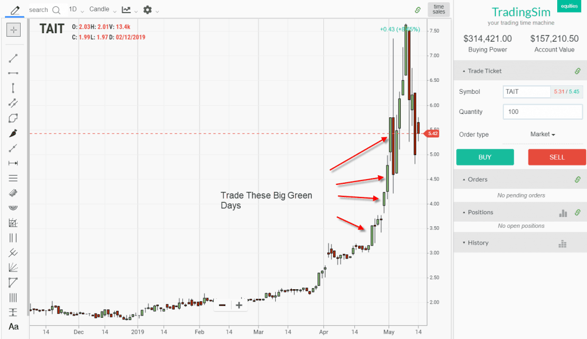
First Big Green Days
Now, I do not trade high-flying stocks because I stick to the lower volatility plays.
However, that doesn’t mean these are not great trade opportunities.
In the above chart, you will see the stock produces a number of large green bars. As a day trader, you can then locate these moves and over a one to two-week period, continuously day trade the setups as they present themselves.
So Is Day Trading with Daily Charts Worth It?
I do not use daily charts on a consistent basis. The largest timeframe I am currently using is 15 minutes and I zoom way out to see if I am hitting any key levels.
But there are times when I will zoom way out to daily and even weekly charts if it appears a stock is testing a significant level.
For me, it comes down to the fact adding daily charts all of the time gives me information overload.
However, if you plan on watching daily, you will need to watch many other timeframes and this will require you to have multiple monitors.
At the end of the day, trading is all about making a profit and if you can do so with daily charts – stick with it.
How Can TradingSim Help?
Tradingsim has over 14 different timeframes for you to practice day trading. We also have daily and weekly timeframes for you to zoom out on the action in order to find prime trading opportunities.


 Day Trading Penny Stocks


