In today’s article, we will cover ascending tops, which is one of the most reliable chart patterns you can leverage when trading bullish price movements.
The reason ascending tops are such a predictable pattern is due to the amount of time and price action required to complete the formation – thus increasing their reliability.
In this article, we will also do a deep dive into a simple trading strategy that consists of three tips for trading the ascending tops pattern.
What are Ascending Tops?
The answer to this question is hidden in the name of the pattern.
Simply, ascending tops consists of price action, where each top is higher than the one before.
Below is an image illustrating the ascending tops pattern:
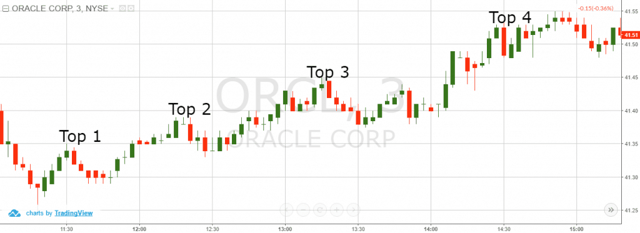
Ascending Tops
There are 4 tops present in the above price chart of Oracle. As you see, after each slight retracement, the stock is able to exceed and close higher than the previous high.
Another key point to note is that the pullback low after each new high does not breach the low of the prior high’s swing low.
That was a bit complicated, I admit. Trust me though, things will begin to clear up as you read further.
Ascending tops are a strong bullish signal on a price chart.
It’s just a matter of probability to be honest with you. If you see a stock consistently making new highs, then odds are in your favor that the stock will continue to perform in a bullish manner.
Believe it or not, sometimes in trading, things are as they appear!
3 Tips for How to Trade Ascending Tops (Successfully)
Now that you are familiar with the structure of ascending tops, I will now discuss a simple, yet effective way for trading ascending tops.
The key word here is “successfully” trade, as there are a ton of methodologies floating around on the web.
Tip #1 – How to Enter the Trade
First you need to confirm that an ascending top pattern is actually present on the chart – no sense in you opening a trade based on poor analysis out the gate.
The first thing you will need are a minimum of two ascending tops and two higher lows.
Once the second high is reached, there is a price correction.
It is your job to determine the best buying opportunity on this retracement.
The simplest way to do this is not to pull out your handy Gann support numbers or some complicated least squares figure. How about simply identifying a support level based on a trend line or a candlestick reversal pattern.
Seems too simple uh?
Well, a picture is worth a thousand words, so let’s review the below chart of Oracle.
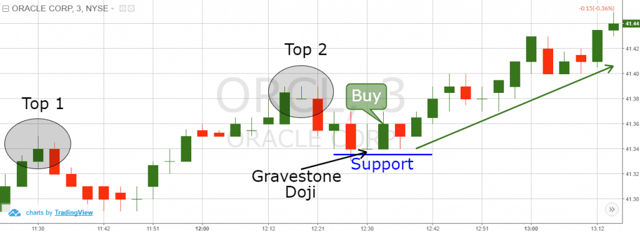
Ascending Tops Support
You are now looking at an ascending top chart pattern example.
After the second top is put in, Oracle pulls back into a gravestone doji reversal pattern. Then Oracle begins to print a bullish candle directly after the doji. What you cannot see in this image, since it is and end of day chart, is the price action after the doji.
Assuming you would have been watching the price action like a hawk, your first shot at entering a long trade would have been once the high of the doji was breached.
Once the high of the doji was exceeded, Oracle never looked back and continued its bullish run.
Tip #2 – How to Place your Stop Loss Orders
While we are a fan of the high reliability of ascending tops, it like any other trading formation can take your house and the shirt off your back if not traded properly.
Therefore, you will want to always and let me repeat, always have a stop loss when trading this pattern.
The proper location of the stop loss is below the low created after the second top.
Please see below for a working example:
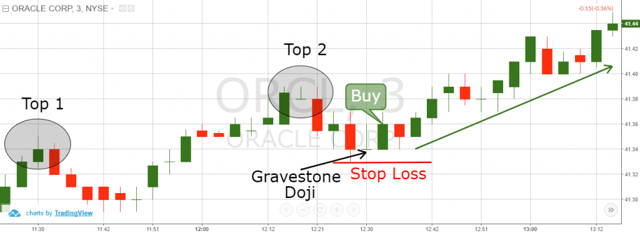
Ascending Tops Stop Loss
Makes sense right?
Tip #3 – When to Book Profits
Tip #3 is what separates the losers from the winners. It doesn’t matter if you are some super smart chart guru walking around with your trend lines and an ego.
At the end of the day, if you are unable to take money out of the market and place it into your pockets, you are a wannabe.
I know that sounds harsh, but none of us are trading for Facebook likes. We are in the game of trading to make money!
So, how long do we stay in a winning trade before we call it quits?
There is one simple rule you can use, which is stay in the trade anticipating a price move at least the same size as the prior impulse move.
Clear as mud?
This is how the price target looks when applied to the previous trade example from above:
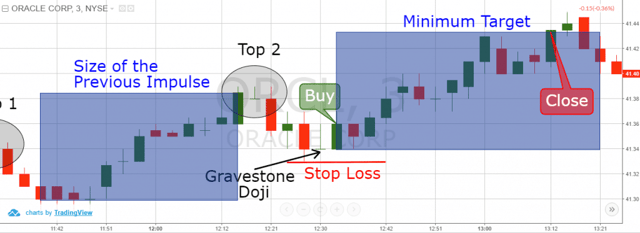
Ascending Tops Price Target
The blue rectangles on the chart measure the size of the trend impulse between Top 1 and Top 2.
As you can see, we apply the size of the previous impulse to the low of our entry candle.
Once the price approaches the top of the rectangular box, we exit our position.
You of course can hold on, but coming from a person that has placed thousands of trades, I have always made the most money when I’m not being greedy.
Pulling it Altogether – Real-Life Ascending Top Trading Examples
Now that we are familiar with the rules for trading ascending tops, let’s look at the application of these principles.
Again, we will use tips 1 through 3 as our guidelines for placing these trades.
Trade Example #1:
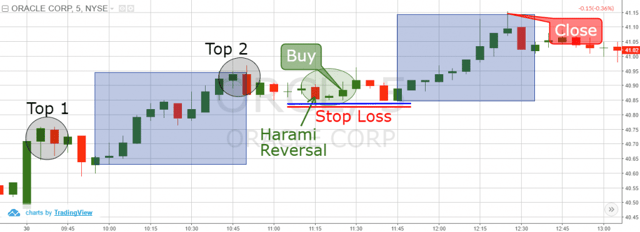
Ascending Tops Real-Life Trading Example
Above is a 5-minute chart of Oracle displaying a clear ascending tops pattern.
We identify the first top shortly after the market opens.
After this top is in place, there is a slight retracement and Oracle then shoots higher to top #2.
Again, Oracle puts in a lame excuse for a pullback, which really looks like a consolidation zone. This consolidation zone is resting on the support line, which we have marked with the blue horizontal line.
While resting on support, Oracle printed a harami reversal candlestick.
The next candle after the harami is bullish and we use this as an opportunity to open our long position.
Never forgetting the market can be a cruel animal, we place our stop loss a few cents below the support (red line).
The price quickly resumes the bullish trend and Oracle continues its climb higher.
Before we become too excited and call out sick from work, let’s identify our price target for the move.
We measure the size of the previous impulse which is located between top 1 and top 2. The size of this move is indicated by the blue rectangles on the chart. We then apply the size of the rectangles from the low of our entry bar.
As you can see, using this methodology for price targets, we were able to nail the next swing high within a few pennies.
Trade Example #2
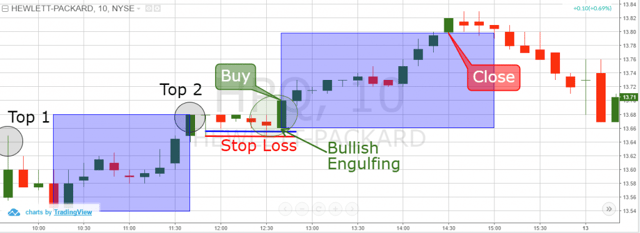
Ascending Tops Real-Life Trading Example 2
This time we have the 10-minute chart of Hewlett-Packard. The image shows another ascending top chart pattern.
Again, we first start by identifying the first two tops on the chart.
After the second top, the price has a slight pullback.
The blue horizontal line represents the pullback from this resistance area.
Suddenly, the price action creates a bullish engulfing candlestick pattern. Therefore, we use this candle as a trigger to go long in order to catch the impulsive move higher.
We then place a stop loss right below the blue support area on the chart.
Please note, if you are unwilling or do not desire to place a stop loss when day trading, please do yourself a favor and do not get involved. You will inevitably blow up your account.
I know that was a bit negative, but trust me when I say I just saved you a ton of financial and mental pain.
Ok. Time to shift back to more positive thoughts!
Lastly, we need to derive our price target for the formation. To do this, we measure the size of the previous impulse between top 1 and top 2.
We then apply this target from the support area, which is all displayed in the blue rectangles.
Ten periods after we buy Hewlett-Packard, the price increases through the upper level of our blue rectangle and provides us with our exit signal.
Therefore, we close the long HP trade, completing the minimum target of the ascending top pattern.
Key Takeaways from the Two Trade Examples
In both examples, the trading conditions were the same.
We were able to use price action rules in order to determine the long entry point on the chart. In the first example, the pattern was a harami, and in the second example, it was an engulfing candlestick.
At the end of the day it doesn’t matter the type of reversal pattern – only that one prints on the chart.
Conclusion
- The ascending tops pattern is a chart pattern, where each top is higher than its predecessor.
- The ascending tops pattern has a strong bullish characteristic. Since the price creates higher highs, the chance that the price creates another high is likely.
- You should confirm the ascending tops pattern by using the following steps:
- Find two tops, where the second top is the higher than the prior one and has a higher low.
- Wait for the price to decrease after creating the second top.
- The decrease should have a corrective nature and not display a sharp move downwards.
- After you confirm the pattern, you can trade the ascending tops pattern based on the following price action:
- Find a support area after the pullback from the second top.
- Identify a reversal candle pattern at the time price is testing a support area.
- Buy the stock when a bullish candle breaks above and confirms the candle pattern.
- Put a stop loss below the support area of the bottom after the most recent high.
- Stay in the trade until the price completes a move equal to the previous impulse.
- In some cases, you will have the chance to extend your gains by holding on the position (remember to be cautious with this approach).


 Chart Patterns


