Apple Inc, trading on the NASDAQ exchange is one of the most popular stocks preferred by both intraday traders and long term investors. Investors flock to APPL stock for a number of reasons ranging from its high liquidity to its market capitalization and the strong fundamentals.
Apple Inc. set a new record of sorts as it created history with a market capitalization of one trillion U.S. dollars. The only other company to hit a one trillion market capitalization was PetroChina which briefly hit the milestone in 2007.
There is no wonder then that the stock is loved by speculators and short-term traders. There are many reasons, which also include the liquidity and the volatility of the stock.
A stock with good intraday liquidity has many advantages. For one, the spread, which is the difference between the bid and ask price is tight, making it cheaper to speculate or day trade. The daily high average volume also means that the fills are tight.
Quite often, one can see that the price you bid for is not always the price you get. In the case of Apple’s stock, however, you can easily see that the price quotes are much tighter.
With a lot of news keeping the markets busy, trading Apple’s stock can certainly be a safe bet for intraday traders.
In this article, we walk you through three simple trading strategies that you can employ for day trading Apple stock. The indicators used throughout the different strategies are also commonly available. This means that you can easily use the Apple stock tips for day trading on almost any trading platform.
Trading 2 Day Highs/Lows
The two-day high low strategy is ideal for short-term speculative trading or day traders. In this trading strategy, the basic premise is to buy the breakout from the two-day high or to sell the break down off a two-day low.
Traders can make quick profits using this strategy but it requires preparation ahead of the market open. It is also ideal to use this strategy during days when there are no major news events. This includes any events such as earnings releases or major events in the sector.
The two-day high-low trading strategy for Apple stock is purely a technical play on the stock. Sometimes, the fundamentals could potentially help to increase the profits as well.
The first step in the two-day high low trading method, as the name suggests is to identify a two-day high and low. The easy way to start is to look for the high and the low from the previous two days, ahead of the opening bell.
It also helps to keep track of the pre-market open. As long as the stock isn’t making any big moves, it would be safe to trade. After plotting the high and the low, switch to a 5-minute chart. Now simply wait for the first 5-minute session to post a close outside the two-day high or the two-day low.
Initiate a long or a short position accordingly at the start of the next 5-minute session. To protect your trade, place the stops at the previous 5-minute session’s low. Aim for a partial close based on the risk taken and move the remaining position to break even.
For the remainder of the trade, aim for a 1:2 risk/reward ratio or look to close the trade at the nearest round number.
Two day high low – Trade example
The chart below illustrates the two-day high-low trading strategy. The rectangle area marks the two-day high and low levels. Following the high and the low that is formed, you simply wait for the first bullish 5-minute session to close outside the two-day high or low.
Once you find the setup, either long or short the trade with the stops placed at the previous lows.
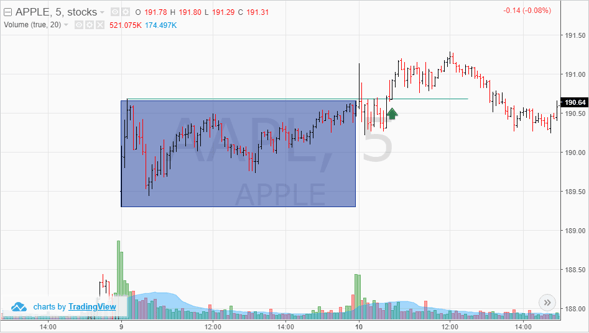
Two-day high low trading strategy
While the strategy looks simple enough on paper, in practice it requires the trader to keep watching the charts. Sometimes, you can expect price action to continue to range with the breakout happening later in the day. On other days, you can expect to see a major move occurring within the first hour of trading itself.
Therefore, it is essential to prepare ahead of the opening bell and also to ensure that there is no major market-moving events.
Trading ranges during low volatility
Trading ranges during periods of low volatility can ensure trades steady profits despite the stock heading nowhere. However, the downside to this method is that there is a risk of being caught up in fake moves. This strategy requires a bit of practice and skill.
Trading during low volatility means that price action is essentially moving sideways. While long or even medium-term traders tend to avoid this, scaling down to the smaller time frame charts can help.
In this trading strategy, you can make use of any oscillator that can help you to identify overbought and oversold levels. The settings for the oscillator also need to be set to a short-term setting in order to be very sensitive to the price action.
While there are many different oscillators one can use, the most common ones include the relative strength index (RSI), Stochastics, or the Rate of Change oscillator. Of course, you are free to experiment with other oscillators as well as their settings.
Once you set up the oscillator, the next step is to change the settings so that it is sensitive to the price movements. You can tweak the oscillator’s overbought and oversold levels to capture the extremes in price action.
By trading the ranges during low volatility, the day trader or speculator is simply capturing the short-term fluctuations in prices. Risk reward ratio in trading this strategy requires some flexibility and there are instances when you can face more losing trades as well.
Day traders should practice this trading strategy on a trading simulator or a demo trading account before using it in the real markets. The market conditions also play a crucial role. Therefore, this strategy is not advisable during periods of high volatility.
Trading ranges with low volatility – Trade Example
In the below example, we use the five-minute chart. For the oscillator, we use the standard relative strength index. The RSI settings are not struck in stone. In this example, we make use of the RSI with a 7-period setting. While there is no “ideal setting” you can experiment with, find a balance between making the RSI not too sensitive and not too lagging either.
For the overbought and oversold levels, we use the 85 and 15 levels. Every time the RSI peaks at or above 85 we go short when the indicator signals oversold levels. Likewise, when the RSI troughs at or below 15, we go long when the indicator signals overbought levels.
You can also plot the recent pivotal high and low points on the chart.
In the example below you can see how price posts a pivotal high. At the same time, the RSI 7 peaks near 85. You can short this position at the next session’s open, targeting the pivotal or recent low.
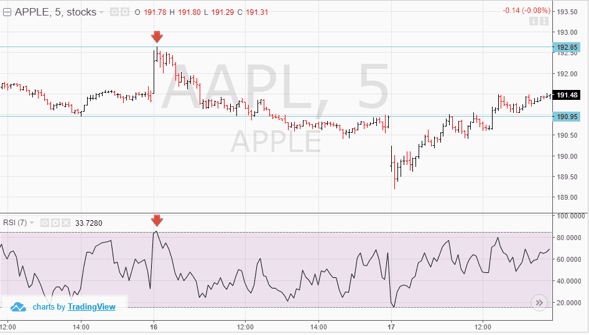
Trading ranges during volatility trading strategy
Alternately, look for the RSI 7 to drop to or at 15 and then go long on the next session’s open. You can then target the recent high to book profits.
You can place the stops at the recent high or the low after you initiate the trade.
GAP-FILL Strategy
The gap-fill strategy, as the name suggests involves trading the gaps. The gap-fill strategy is a very simple approach to trading. In this strategy, day traders look for price to gap from the previous day.
A gap in a stock’s price forms when there is a significant difference between the previous day’s close and the current day’s open. Gaps form due to pre-market activity and huge orders which bids up or down the price creating gaps.
There is a common saying that gaps are meant to be filled. While this may be true, a gap is not always filled immediately. Gaps can also serve as support and resistance levels depending on the market conditions.
The most common types of gaps are the common gaps, which is what we will use in this day trading strategy for Apple. Other types of gaps include the breakaway gap, continuation gaps, and exhaustion gaps.
Gaps can also be used to understand the trends in the price chart.
The common gap is known as such because such gaps tend to be filled quickly; in some cases during the intraday session as well.
To trade successfully with gaps, traders need to have their charts ready at least 30-minutes before the market open. It would also help to get to know the pre-market trading price so you can anticipate if a gap will form or not.
GAP-FILL strategy – Trade Example
The first step is to identify the gap from the previous few days and mark the closing price with a horizontal line. The goal of the gap fill strategy is to go long when price fills the gap as it declines to the gap. For short positions, we look for price to rally to the gap before it turns around.
Making use of a standard oscillator with intraday settings to adjust for sensitivity can help to pick better trades.
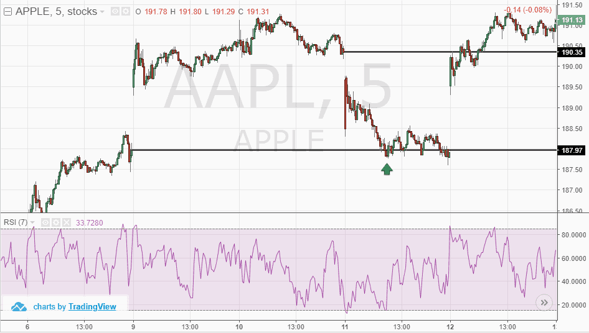
Gap-fill trading strategy example
In the above chart illustration, you can see that we identify the gaps from the previous days. Mark the gap with a horizontal line. We also use the RSI indicator with a 7-period setting and 85 and 15 for overbought and oversold levels.
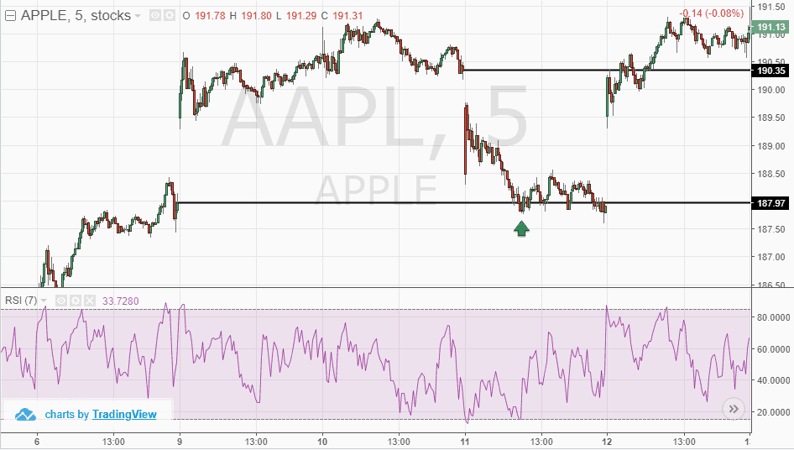
Now, you can see that when the price falls to the previous closing price, the RSI can determine the overbought level. In the first example, the RSI falls to 15 and then reverses. You can initiate a long position while you target the next gap.
Price eventually rallies to this level where you can book profits. Traders need to strategically place the stops because price can tend to squeeze the position before turning around. Therefore, look to the left side of the chart and pick a price level. Alternately, since the next gap is already known, you can also set your stops based on the risk/reward ratio of 1:2.
Once price moves in your favor, cover the stops to break even so the trade is now risk-free.
For short positions, you can flip the strategy around. Look for price to rally to the gap and watch the RSI turn to oversold levels. At this point, you can initiate short positions based on the RSI.
Apple day trading strategies – Recommended strategy
The Apple day trading strategies outlined above are simple to use. Because every trader’s personality is unique, it is in your own interest to experiment with the strategies to find one that suits you best. Some traders prefer not to spend too much time on the charts, analyzing the indicators. Some traders are absolutely comfortable with chart watching.
Between these, one can choose either the gap fill strategy which is visually easy to identify or trade the volatility breakout method.
One of the things that is common to all the three Apple day trading strategies is that they are intraday setups. Therefore, traders can set up the charts and find a trade rather quickly. The common advantage to all the three-day trading strategies is that once you make a profit for the day, you can simply walk away.
Overtrading, as one might already know comes from greed. Therefore, it is essential that traders maintain discipline and control when using these simple day trading strategies.


 Awesome Day Trading Strategies


