Williams %R Indicator – 3 Trading Strategies and Formula
Jun 20, 2019
Written by: Al Hill
✓ Reviewed by Kunal Vakil, Co-Founder of TradingSim · Updated Mar 31, 2026
I feel like I am on an oscillator craze lately, but if it feels right, why fight it?
The Williams %R indicator is pronounced Williams Percent R. The indicator is the creation of famous technical analyst and charting enthusiast Larry R. Williams. [1]
The Williams %R is a momentum indicator, which gauges if a stock is overbought or oversold.
In this post, we will discuss how to calculate the indicator and 3 trading strategies you can test in the market.
I am the first to say not to worry about remembering an equation by heart. However, I do believe it is important to understand its underlying components.
As you can see above, the indicator is all about the high, close and low prices. Another way of thinking about the indicator at a high-level is that its primary focus is to identify the volatility and momentum for a security.
The n in the formula is the number of periods or candlesticks in the equation.
Although Larry Williams initially calculated the indicator using 10-periods, your charting package will likely use 14 periods. The number of periods is configurable by you; however, it’s a slippery slope once you start mucking around with the settings.
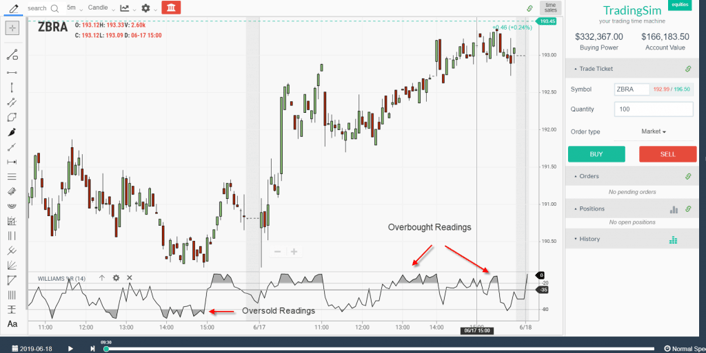
Williams %R Chart Example
Williams %R Readings
The oscillator has a range of -100 to 0. Readings below -80 represent oversold territory and readings above -20 represent overbought.
Now, this does not mean you should buy readings below -80 and sell readings above -20.
During a strong uptrend, a stock can hover around -20. Conversely, in a strong downtrend, a stock can stay in the -80 territory.
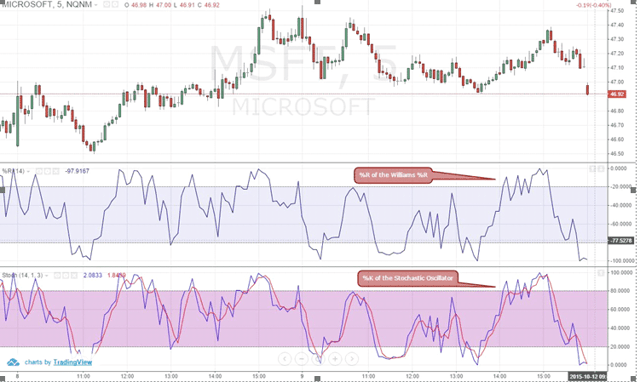
Relationship between Williams %R and the Stochastic Oscillator
No discussion about the indicator would be complete if you do not compare the indicator to the Stochastic Oscillator.
Stochastic Oscillator
While there are two variants of the Stochastic Oscillator, the formula below is for the Fast Stochastic Oscillator [3].
As it has two plotted lines, %K and %D, the formula to calculate these two data points are as follows:
As you can see, the Williams %R is the inverse of the Fast Stochastic Oscillator.
The Williams %R indicator represents the level of the closing price to the highest price for “x” number of periods. By contrast, the Fast Stochastic Oscillator represents the level of the closing price to the lowest price for “x” periods.
Different Ranges
The Williams %R multiplies the formula by -100 whereas the Stochastic Oscillator multiplies the formula by 100.
Comparing Williams %R and (fast) Stochastic Oscillator
As you can see the movement is essentially the same. The one major difference is the stochastic oscillator gives you a trigger line which you can use to execute entries and exits.
Three Trading Strategies
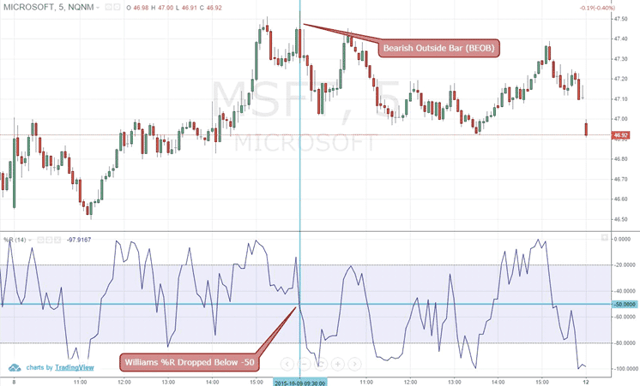
Strategy #1 – Cross of -50
Instead of using the indicator for simply identifying overbought and oversold market conditions, you can develop a trading plan around the -50 line cross.
Example of Taking a Short Position with Williams %R Momentum Strategy
Example of -50 Line Cross Strategy
After becoming overbought and oversold, if the indicator crosses the -50 line, it generally indicates a shift in momentum. At this point, you can start to look for opportunities to trade the stock direction of the cross.
In the above chart example, the %R of MSFT was overbought. The stock price then began to decline and the %R crossed below the -50 line.
Once crossing below -50, you then wait for the bar to close to place a sell order.
Combine Price Action to Increase Odds of Success
As you can see, the bar that pushed the indicator reading below -50 was a bearish outside (BEOB). If you simply placed a sell stop order below the low of this bar, you would have entered the market when the bearish momentum was at its highest. Hence, you could have gotten away with placing a smaller stop-loss, which would, in turn, increase your risk to reward ratio on this particular trade.
You can use this same strategy to take a long position when the %R crosses above -50 from after being oversold for some period of time.
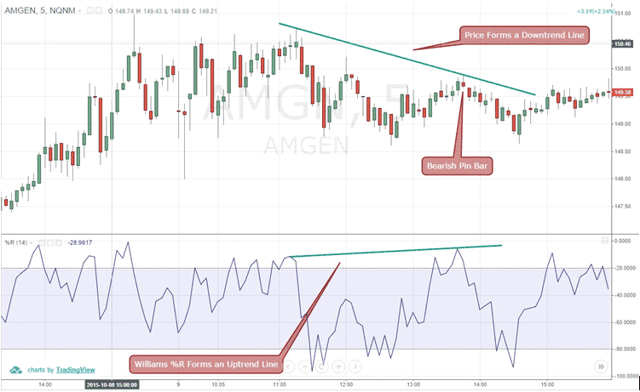
Strategy #2 – Divergence Trading Strategy
Trading Williams %R Divergence
If you are familiar with divergence, you essentially want to find points areas where price and the indicator are in conflict.
Williams %R divergences are very powerful you should pay attention to these when it happens. In the above chart, you can see AMGN formed a clear downtrend; however, the Williams %R made a higher high.
This kind of divergence suggests a trend continuation. As you can see, after forming a bearish price action bar, the AMGN price shortly resumed the downtrend and you could have easily placed a sell stop below the bearish bar to capture this short swing.
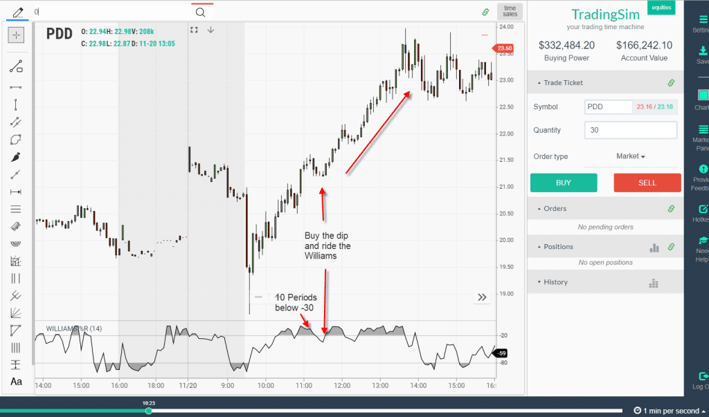
Strategy #3 – Ride the Williams
Have you ever heard of the strategy where you ride Bollinger Bands? Well, you can do the same thing with the Williams %R.
Here is the setup and you will love its simplicity.
First look for the indicator to break -20 to the upside, so the shading kicks in. Then wait to see if the indicator can stay below -30 for 10 periods in a row.
If the stock is able to show this level of strength you can then use the first dip as a buying opportunity to jump on the primary trend.
Ride the Williams
As you can see in the above chart, once you are in the position, you can then ride the stock until the stochastics breaks -30 on the way down.
The hardest part of this strategy is not pulling the trigger too soon.
Conclusion
Since Williams %R lines are similar to the Fast Stochastic Oscillator, you can simply use the Stochastic Oscillator. But, remember that the intended trading strategy of the Williams %R is completely different compared to the Stochastic Oscillator.
Like other momentum indicators, it has its flaws, as it can remain extremely overbought during an uptrend and vice-versa [4]. However, as we showed here, you should not use the Williams %R to blindly take a position in the market based on its overbought and oversold readings.
Instead, if you trade smartly by combining price action and use the indicator to confirm the momentum in the market, your chance of ending up with a profitable trade would increase tremendously.
How Can Tradingsim Help?
If you are interested in the Williams %R, you can practice trading with the indicator against real-tick data within Tradingsim. First, see if the indicator works for your trading style before placing real trades in the market.
Alton Hill is the Co-Founder of TradingSim with over 18 years of trading experience. He completed the Design Thinking Bootcamp at Stanford’s D.School and brings expertise in Product Development to create the best trading simulation experience. His strategy focuses on trend-following systems, targeting high-volatility stocks with strong primary trends using the 15-minute chart.
Ease of Movement Indicator (EMV) – The Best Way to Interpret Price Action
What is the Ease of Movement Indicator? The Ease of Movement (EMV) is an oscillator, which analyzes the relationship between price and trading volume. The EMV indicator has an uncanny ability to...
5 Key Differences between the Stochastic RSI and Stochastic [Updated April 2026]
What is the Stochastics Oscillator? While there are many oscillators, the Stochastics and Stochastic RSI are two of the most popular technical indicators. So, why do we need two indicators with...
Slow Stochastics –Strategies, Calculations and Difference Between RSI
In this article, I am going to discuss the basics of the slow stochastics indicator and then dive into trading strategies you can test in the market. Slow Stochastic Definition The slow stochastic...


 Momentum Indicators


