What are the Fibonacci sequence and the Golden ratio?
A Fibonacci sequence is a number pattern that was discovered and introduced in the 13th century by the Italian mathematician Leonardo of Pisa, who was also known as Fibonacci. This is debated, however, by historians who believe the sequence was actually discovered by Indian mathematicians hundreds of years prior.
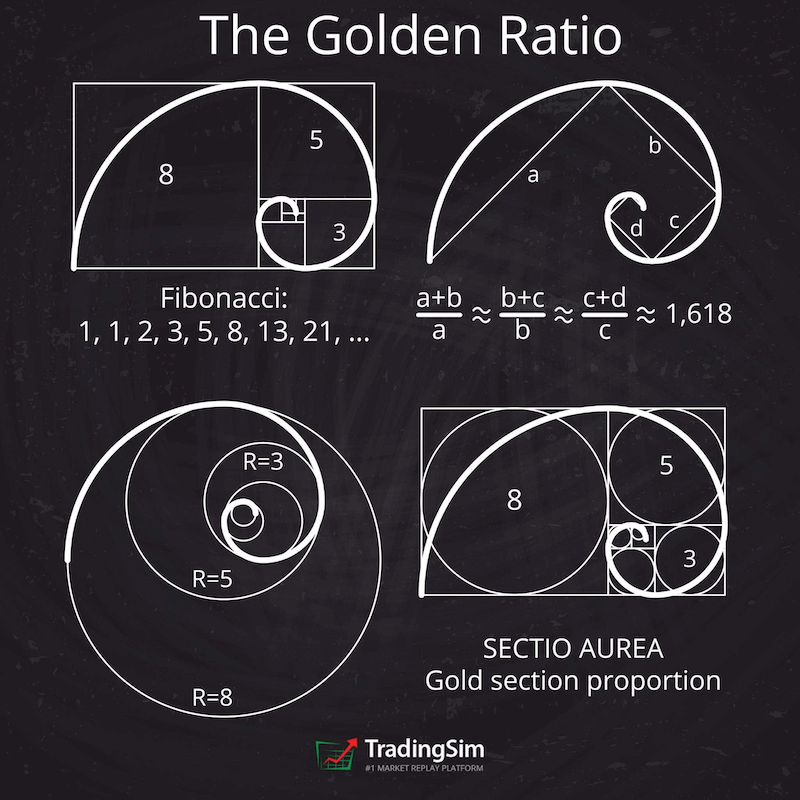
In this number sequence, each number is the sum of the two numbers immediately preceding it. As the sequence continues, they form a pattern where each number is approximately 1.618 times greater than the preceding one.
The number 1.618 is called the Golden Ratio or Phi. Interestingly, many natural objects and artificial architectures, such as rose petals, human faces, the Great Pyramid of Giza, and many famous paintings, all follow the golden ratio pattern.
Because the Fibonacci sequence and the golden ratio abound in nature, traders believe that they can also be used in the financial markets to predict price movements. Traders use the Fibonacci sequence and Golden Ratio for determining pullbacks and impulses on price charts.
What is Fibonacci Retracement?
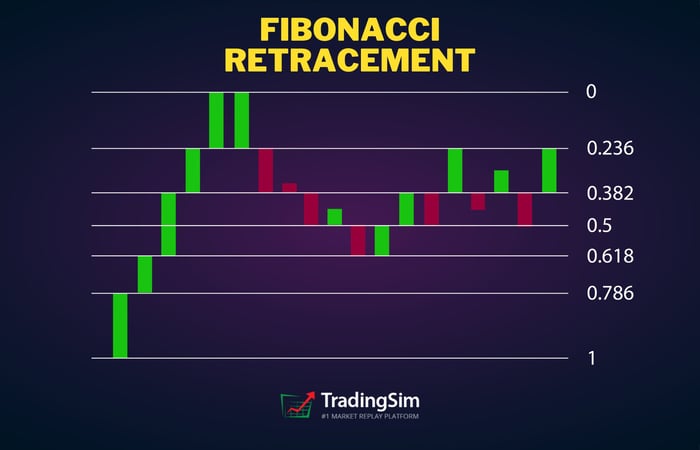
The Fibonacci retracement originates from the Fibonacci sequence, which highlights support and resistance levels by drawing horizontal lines on a price chart. The retracement levels are set at multiples of 1.618 or the golden ratio. For example, the first retracement level is at 23.6%, followed by the second level at 38.2%, the third at 61.8%, and the fourth at 78.6%. So, when there is a strong up or downtrend, the price usually retraces at any of these levels.

The Fibonacci retracements are widely used to determine price levels for impulses and pullbacks in an uptrend or a downtrend. For example, in an uptrend, the price often makes small pullbacks and then again continues trending upwards.
Fibonacci retracement can help traders determine the level of support where the price pulls back before continuing in the direction of the trend. The retracement level can be used as a potential entry point in a trending market. While Fibonacci retracements can be useful, you should use them in conjunction with other indicators to corroborate your findings.
Is trading with Fibonacci profitable?
Price charts represent traders' psychology, and Fibonacci numbers can help you interpret the price charts and important price levels. However, like any other technical indicator and tool, Fibonacci, too, has its limitations. So, it is important to know when it works the best and how you can use it to execute your trading strategies profitably.
Traders can use Fibonacci sequences and Fibonacci retracements profitably in trending and fast-moving markets as the strategy works well most of the time in such conditions. In contrast, it doesn't work as well during market corrections and range-bound conditions.
The Fibonacci tool can help you find entry and exit points on the price chart and also facilitate placing your stop loss and take profit points. This allows you to trade purely on the basis of price action, taking emotions away from your trading.
How to calculate Fibonacci retracement lines?
Fibonacci retracement lines can be calculated by finding out the position of different Fibonacci percentages from a given price point. Let us illustrate this with an example:
Suppose the price of a stock increases from $20 to $30, you can calculate the 23.6% Fibonacci level in the following way:
$30 - ($10 x 23.6%) = $27.64
According to the calculation above, the 23.6% Fibonacci line should be at $27.64 if the price increases by $10 from $20 to $30.
Similarly, you can also calculate the 50% Fibonacci level, though it isn't "technically" considered part of the sequence.
$30 - ($10 x 50%) = $25
The equation shows that the 50% Fibonacci level for the price increase from $20 to $30 is $25. This means that the price should retrace at $25 while trending upwards from $20 to $30.
The Fibonacci levels are based simply on percentages and are derived by dividing a number by the next one in the sequence.
How to draw Fibonacci retracement levels?
To draw Fibonacci levels on a price chart, you need to first draw a trend line between two points. When you intersect the trend line, different horizontal lines are automatically drawn at different Fibonacci levels, such as 0%, 23.6%, 38.2%, 61.8%, and 100%. A line for 50% level is also drawn, although it is not technically a part of the Fibonacci level.
If you see that a stock's price is trending higher and has retraced to a Fibonacci level, it might be an indication that the stock might continue its overall trend unless another indicator tells you otherwise. For example, you can use an MACD indicator or a stochastic indicator to further solidify your analysis before executing your trade.
How to use the Fibonacci retracement indicator?
Fibonacci retracement indicator is quite useful in determining entry and exit points in a trending market. Traders can also use it for risk management purposes as it allows them to find stop-loss and take-profit points.
Suppose, a stock is trending upwards, but it retraces to the Fibonacci level of 50% and resumes its upward journey. The trader can set a stop loss point just below the 50% level and enter the trade at this level. The risk in the trade would be low as compared to the profit potential because the trader is protected by a stop-loss order placed near the entry level.

The Fibonacci levels make sense as prices do not move in a straight line up or down. Instead, they move in a zigzag fashion, which depicts momentary ups and downs in the prices while continuing the broader trend.
One particular advantage of using Fibonacci retracement indicator over other indicators is that it is a static indicator. Using a static indicator means that you can anticipate a certain price behavior at a particular price level, which can be traded profitably.
These levels are actually inflection points where prices either reverse or break key levels. In contrast, variable indicators change with the different time frames and can give you conflicting results.
How to read Fibonacci retracement lines?
You can create the Fibonacci retracement lines by drawing a trendline between two points and connecting these points on a price chart. The retracement lines are drawn automatically, which depicts different Fibonacci levels. For example, if the price of a stock rises from $20 to $30, and you connect the two price points using a trend line, various horizontal lines are drawn. These lines are called Fibonacci retracement lines and show different price levels at various Fibonacci percentages.
For example, if the price of a stock, future, or a currency pair increases by $10 from $20 to $30, the retracement line at 23.6% Fibonacci level would be at $27.64 price level. You can expect the price to retrace at this price point and then resume its upward trajectory towards $30.
You can enter the market at 23.6% Fibonacci level or $27.64 price level while keeping a stop-loss just below this level, perhaps at $27.00. This would limit your downside risk while giving you a chance to earn a higher profit on the trade. If the price fails to keep the upward trend, your stop-loss would be triggered without hurting you too much on one trade. In contrast, you could earn a much bigger price if the price indeed carried on with its existing trend.
Is Fibonacci retracement a good strategy?
Fibonacci retracement indicator does a decent job in accurately identifying key reversal points. However, using it can be difficult in comparison with executing your strategies on historical price charts. You need to use the strategy in conjunction with other trend-reversal indicators and strategies. Trend reversal strategies are popular among traders as they usually provide them with low-risk and high profitability trading opportunities.
The strategy not only highlights entry and exit points, but it also reduces your risk by indicating a low-risk stop-loss point as well. If you find another indicator that confirms a trade signal, you can execute high-probability and high risk/reward trade with minimal risk as the stop-loss level is kept very close to your entry point.
It is one of the simplest trading strategies you can use as the indicator provides you with fixed and static inflection points where prices either break or reverse. In contrast with other indicators and strategies, you can get clear and quick signals on whether to take a trade or ignore it as these price levels are not lagging indicators but rather created mathematically keeping in view an uptrend or downtrend.
How to trade the Fibonacci retracement?
Traders mostly use the Fibonacci retracement indicator during trending markets. Retracements do occur within a broader trend, which you can identify using Fibonacci retracement lines. At the retracement price level, you can enter the market and place your trade in the direction of the overall trend.
Fibonacci Retracement with VWAP Boulevard
We don't recommend doing this without some other confirmation. One way to trade the Fibonacci retracement is to compare it with an intraday vwap boulevard level or wait for a lower high to form.
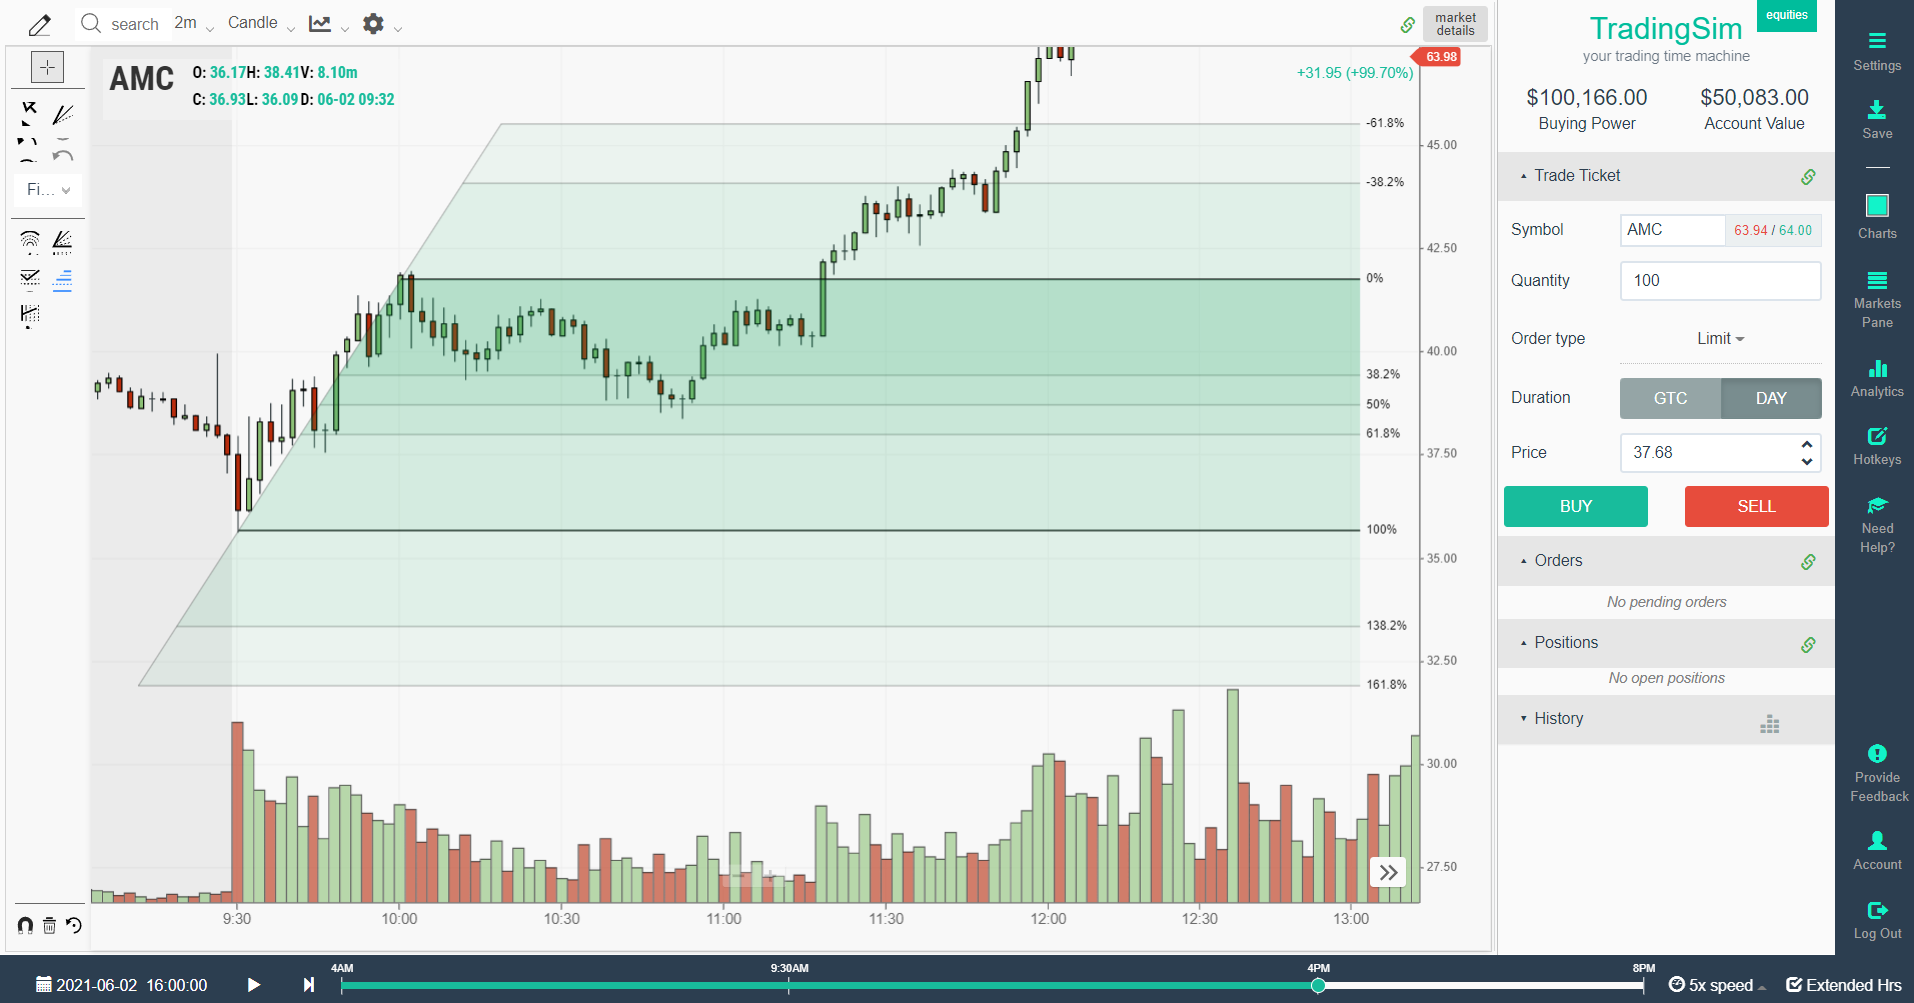
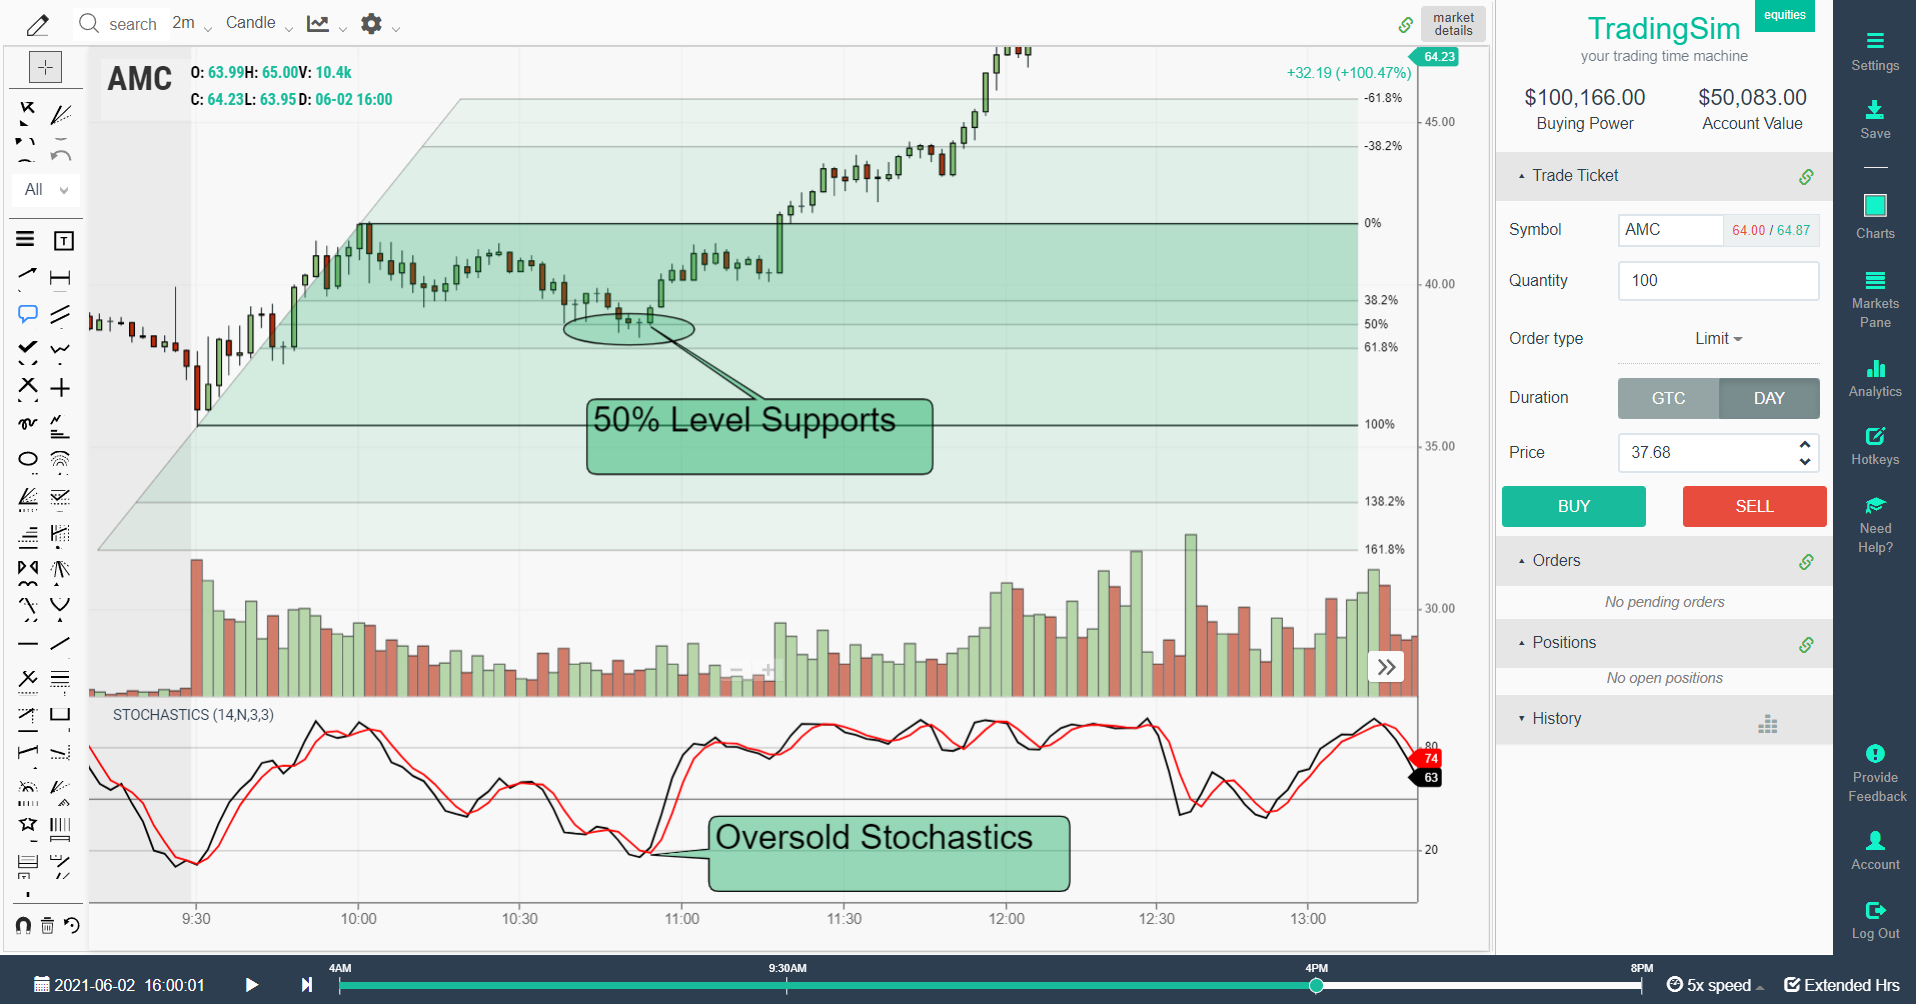
Let's look at our AMC example above one more time:
To make the best use of the indicator, you need to use it in conjunction with other trading strategies as well. For example, you can combine it with the VWAP Boulevard indicator. Notice in the example above, we have drawn intraday vwap boulevard lines using the drawing tool in TradingSim. The pink and purple lines correspond with the highest volume support levels from the opening uptrend in AMC that morning.
These levels correspond with the underlying Fibonnaci retracement levels and confirm that a buyer is stepping in to support the pullback. Once we confirm a higher low, we now have a solid risk/reward setup.
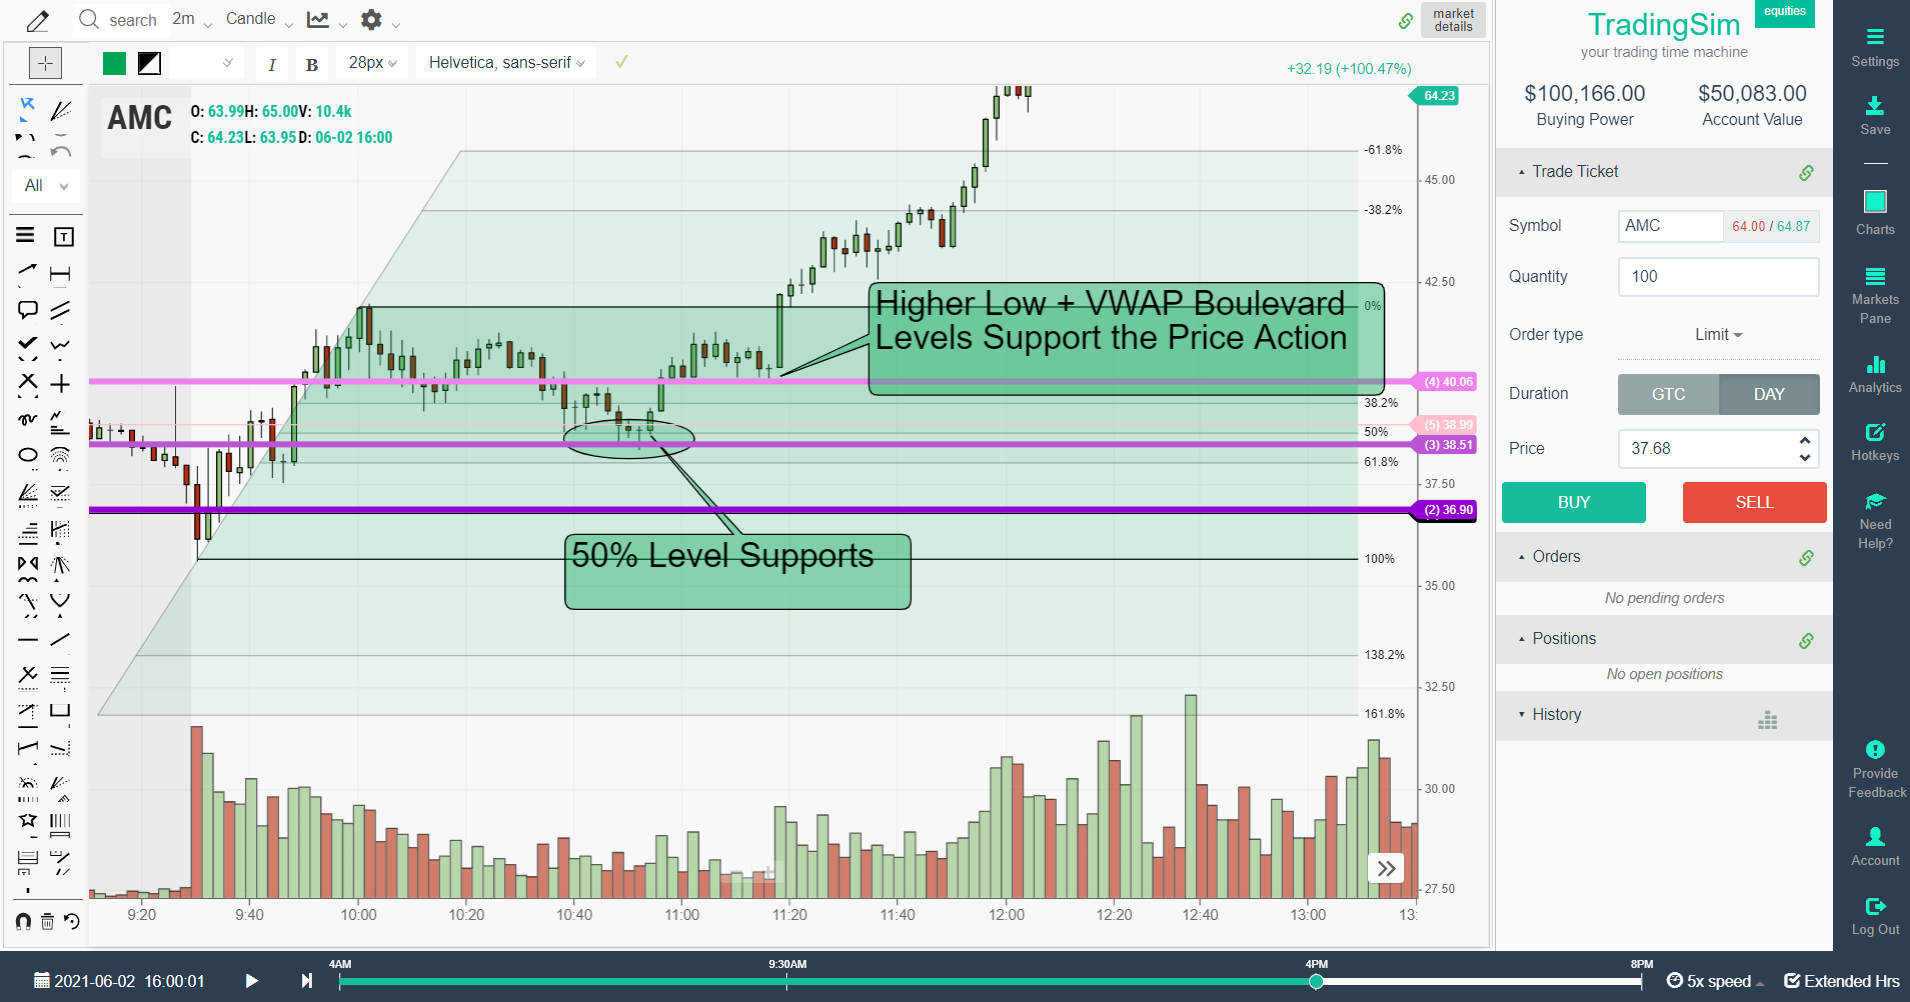
Fibonacci Retracement with Stochastics
Alternatively, you can also use Fibonacci lines with the stochastic indicator. The benefit of using these two indicators simultaneously is that the stochastic indicator would indicate overbought and oversold levels at different Fibonacci levels, allowing you to determine the strength of the retracement. An oversold condition at a key retracement level could mean that the trend might continue, indicating a good position for entering the market.
In a nutshell, the Fibonacci retracement tool works best when used along with other technical indicators. Relying on a single indicator might work for some time, but you can suffer losses in the long run if you don't develop a strategy to confirm trade setups using other indicators as well. A strong trade signal is one that is confirmed by more than one indicator.
Fibonacci retracement chart examples
When you apply the Fibonacci retracement tool to your price chart, you get a price chart with many lines that depict different price levels.
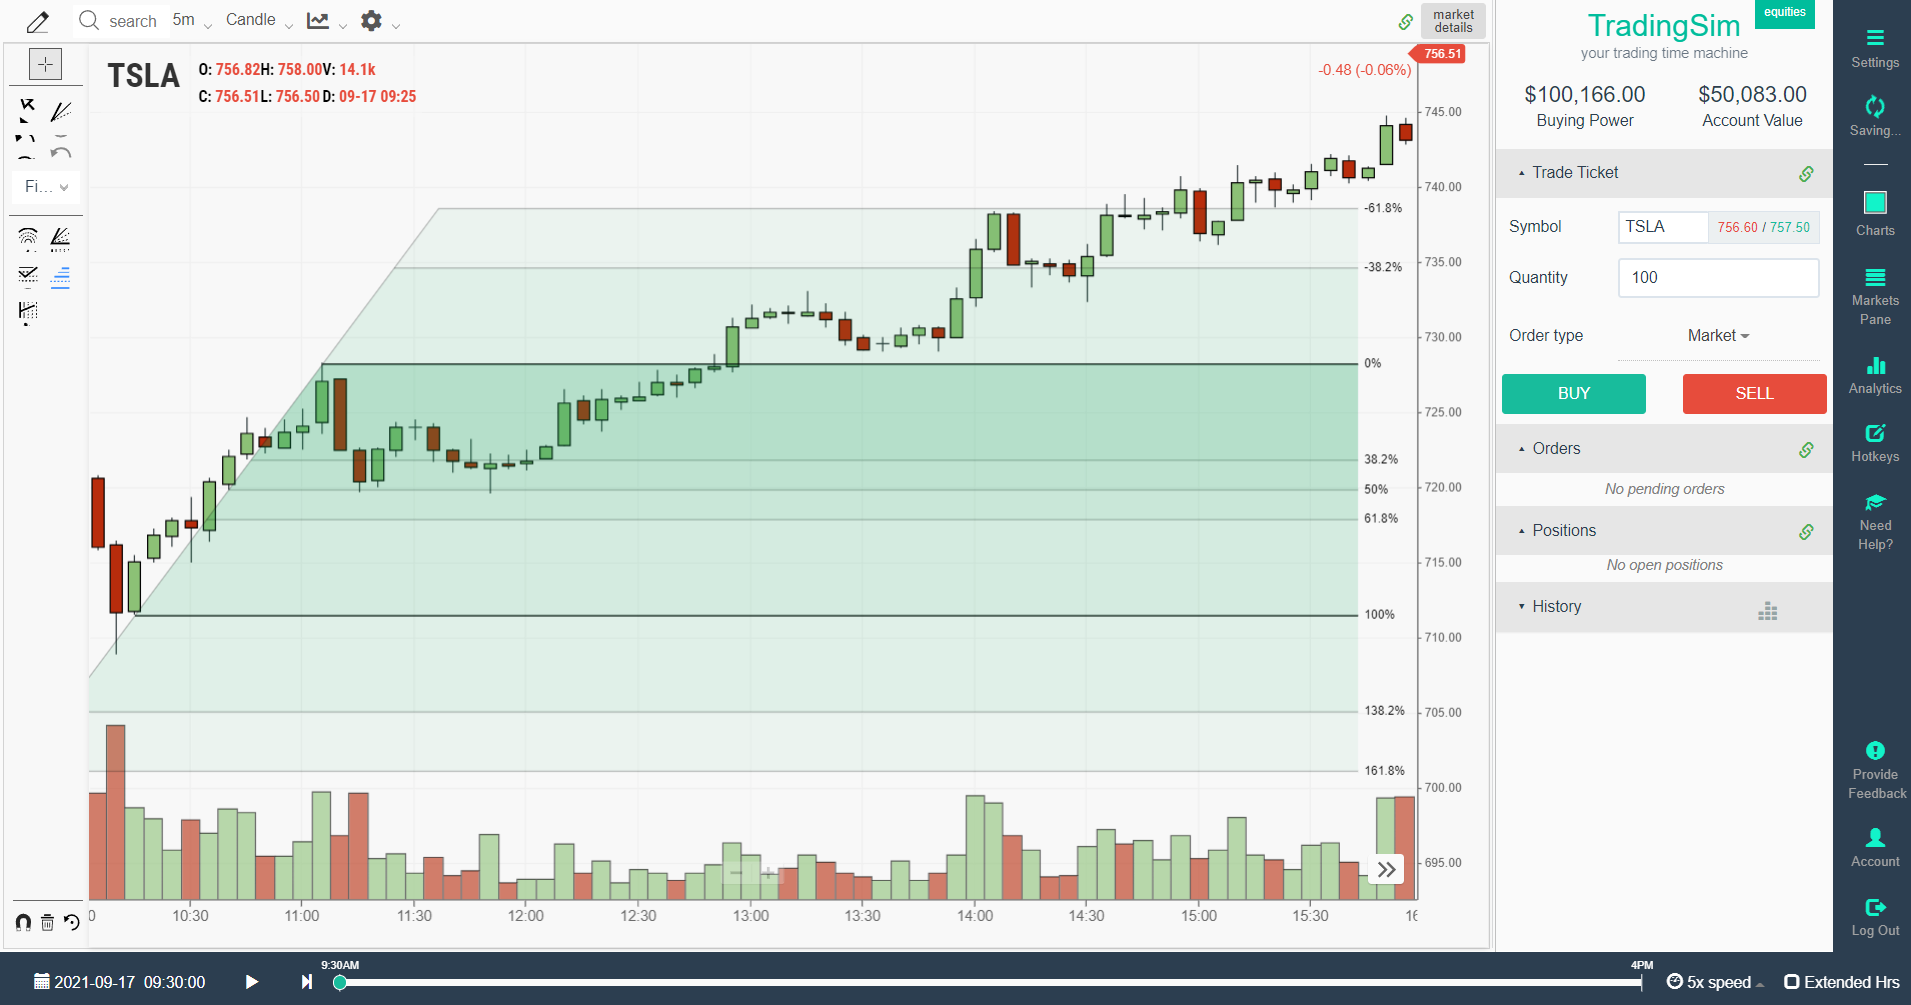
The price chart of TSLA above shows various Fibonacci retracement levels, and you can see that the price indeed found support at some of the retracement levels as highlighted by the indicator.
You can use these retracement levels on different time frames for better analysis. Although you can use the indicator on any timeframe, experts are of the view that retracement levels on higher time frames are usually more reliable than the shorter timeframes.
Conclusion
Fibonacci retracement levels provide traders with interesting insights into the price action. The retracement levels plotted on the price charts help them understand the possible pullbacks or retracements during a trend. Traders can use it to find entry points, exit points, stop-loss levels, and take profit levels.
While the indicator is simple to use and works well under trendy market conditions, it is better to use it in conjunction with other indicators to confirm trade signals.
For more strategies based upon the Fibonacci indicator, head over to our article on Fibonacci extensions.


 Day Trading Indicators


