Volume Rate of Change – 4 Things to Consider Before Trading
Jul 3, 2011
Written by: Al Hill
The Volume rate of change or VROC is a technical indicator that measures the rate of change in volume.
In principle, the VROC behaves similarly to the Price rate of change (PROC) indicator. However, it is obvious that while PROC measures the rate of change in price, the VROC indicator measures the rate of change in volume.
Volume is one of the most powerful indicators that day traders can make use of. It is available to just about anybody and is a default indicator on most charting platforms. Volume is nothing but the total aggregate of the number of shares that changed hands.
Volume does not differentiate between shares that are only bought or only sold but rather accounts for both buying and selling.
Using volume, one can analyze the stock’s behavior very clearly. Volume can at times help traders to understand whether the market movement is valid or not.
In fact, most of the chart patterns that are commonly used, such as the head and shoulders pattern, the bullish and bearish flag, and pennant continuation patterns also account for changes in volume prior to the breakout.
1 – Why should you pay attention to volume?
Firstly, volume is only applicable in markets where the asset or security is cleared via a centralized exchange. This means that only stocks and futures fall into this category.
Spot forex, which is traded over the counter (OTC), is not a perfect example as the spot currency markets are decentralized and there is no central clearing agency.
Therefore, volume analysis is mostly applicable to just stocks and futures. For example, stocks are cleared at an exchange such as the NYSE, while futures are traded at the CME Group.
This level of centralized exchange makes it possible for every trade or contract to be logged in the exchange’s books.
Volume is the information that is available to every trader and market participant.
There are many volume-based indicators which can give traders a completely different perspective of the security being traded.
Many traders tend to focus just on price. But also considering volume can help in expanding one’s horizon and gives a better understanding of what other traders and market participants are doing.
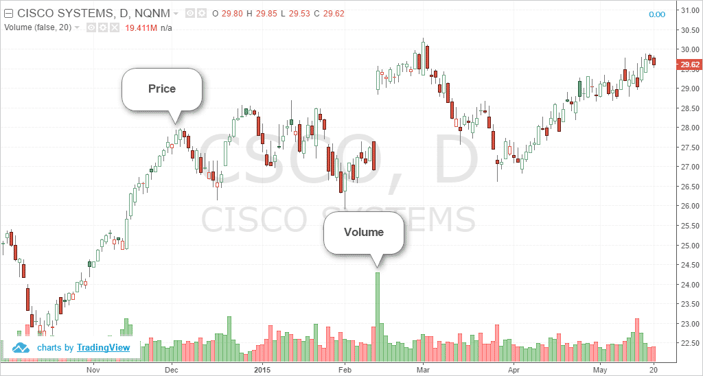
Volume is typically plotted on the price chart at the bottom.
Depending on the security being analyzed, volume can change. Besides volume, there is also a 20-day average volume. This works similarly to a simple moving average. The average volume will quickly tell you how popular a security is. You can of course change this to a 10-period or even 5-period average volume.
It is often advised that traders should only trade those securities that have high volume. There are a number of reasons behind this. For one, a high volume security means that it is very liquid.
Buying and selling a high-volume stock is easy, especially for day traders. At the same time, a stock with high volume can also help it to absorb any abnormal buying or selling from institutional investors.
The first chart below shows a very simple chart of a security with price and volume.
Price and Volume Chart
2 – The Volume Rate of Change Indicator
The Volume rate of change indicator measures the rate of change in volume over the past “n” sessions. In other words, the VROC indicator measures the current volume by comparing it to the volume “n” periods or sessions ago.
VROC can be a powerful technical indicator. When the rate of change is high, you can then compare price to any technical support or resistance levels or use any other price based technical indicators as well.
In such circumstances, the volume rate of change indicator can tell you ahead of time whether the support or resistance levels can be breached and can confirm trends as well.
The Volume rate of change indicator is calculated as follows:
You can see that the similarity in the calculation of the volume rate of change and the price rate of change is just the “price” variable being replaced the “volume” variable.
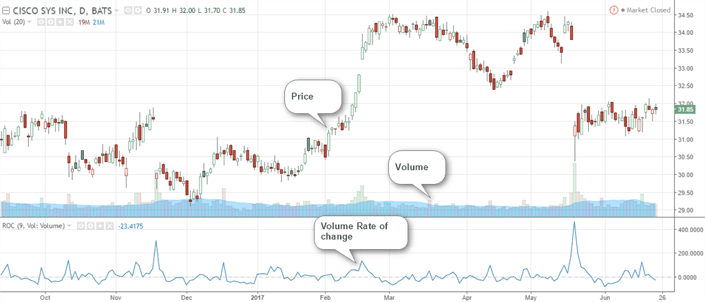
The next chart below shows the price, volume and the volume rate of change indicator applied to the chart.
Volume Rate of Change Indicator
As you can see from the above chart example, the volume rate of change indicator is an oscillator that moves around the zero-line. The spike in the VROC indicator shows when the rate of change is high.
The volume rate of change indicator measures volatility if you look at it closely. When volume rises, there is more activity in the stock’s transactions. Therefore you can expect to see higher volatility. Similarly, when you notice that the pace of change in volume is very low, it means that there is not much of interest in the stock.
Therefore, during low volumes, the volatility can remain flat and so will price. This will result in a sideways market.
If you refer to the above chart again, you will notice the large down gap that was formed in price.
Price of the security fell from around $34.00 to $31.00 approximately. This resulted in a big surge in volume. This was aptly reflected by the volume rate of change indicator. Thus, high volatility equals higher volumes, reflected by higher VROC readings.
An important point to note is that the volume rate of change indicator will not tell you the direction of the market. The VROC indicator only alerts you to the potential rising or falling volatility.
Depending on the charting platform you use, the VROC can be used from the Rate of change indicator. You can choose what data to use. If you use price, the rate of change indicator becomes a price rate of change indicator. When you use volume as the source, it becomes the volume rate of change indicator.
3 – Interpreting the Volume ROC
As with most technical indicators, interpreting the volume rate of change indicator can be subjective.
But, we do know that the volume rate of change indicator merely measures the rate of change in volume compared to “n” periods ago. So the first question that comes to mind is how to configure the setting.
Some traders use a 10-period setting, while others prefer 20-period setting for the VROC indicator. At the end, it is up to the day trader to experiment with different settings for the VROC indicator.
One should also take into account the fact that the volatility of the security can rise or stay flat over prolonged periods of time. Therefore, a day trader must take into account all these factors when deciding on what period setting they should use.
For starters, a 10 or 20-period setting for the VROC indicator is ideal and later, you can fine tune this setting based on the security being analyzed. You should also consider the settings based on the time frame you are using.
Because the VROC plots based on sessions, you can use the volume rate of change indicator on either the daily charts or even the intra-day charts.
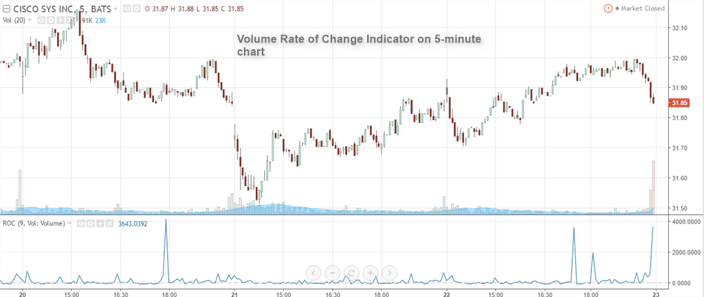
The next chart below shows the VROC indicator used on a 5-minute intraday chart for a stock.
Volume rate of change indicator 5-minute chart
You can see that there is no difference between using the indicator on the daily session or a 5-minute session. Because volume is also broken down based on the session, one can use this across any time frame.
4 – How to use the volume rate of change indicator in technical analysis?
The volume rate of change indicator can be used in a number of ways. There are quite a few trading strategies that also employ the information from the VROC indicator. Here are some of the ways you can use the VROC indicator in your analysis.
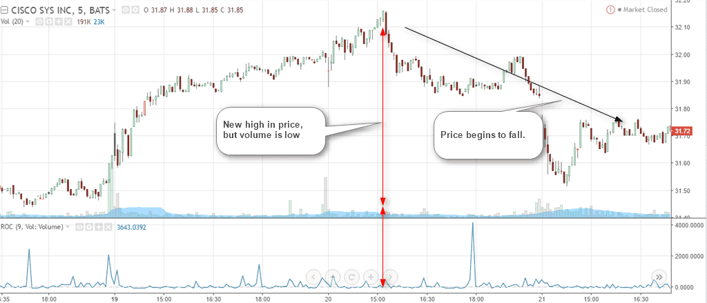
Using the VROC indicator to spot fake market moves
Most commonly, the volume rate of change indicator can be used to determine fake breakouts in the market. When markets are trading at a new high, volume is typically stronger. This validates the high and new interest in the security pours in pushing volume higher.
However, when volume fails to validate a new high, you can expect to see a correction in the price.
VROC as a confirmation tool
In the above chart you can see how price rallied on an intraday basis to post a new high at $32.15 approximately. This new high should generally coincide with a surge in volume as well.
The low volume suggests that the rally was a fake move. This is also validated by the fact that the volume rate of change was very low during this period.
So far, we already have the information that the price rally was a fake rally. But we need further confirmation of this. We now look to support and resistance levels and see how price reacts to these levels in terms of behavior or changes in volume.
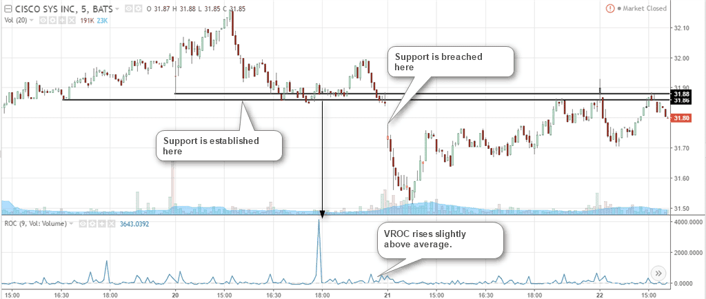
In the next chart below, we can see that the support level has been identified based on the price behavior in the past. The support was formed at $31.88 – $31.86. When price briefly falls to this level, you can see a surge in the volume. This is also reflected by the rise in the volume rate of change indicator.
This indicates that there is some buying interest at the support level, so we can now confirm that if price breaks below this level, we can go short.
Later, when price gaps down lower, there is a clear break of this support level with the down gap. A short position could be taken here with price continuing to push lower. Further to the right side of the chart, you can see price rallying back to this very support level.
The support now turns into resistance. There is also higher activity in the volume rate of change, suggesting that sellers are now entering the market. Therefore a new short position could be initiated here as a result of the analysis.
VROC analysis
VROC analysis
From the above example we can see that the VROC indicator along with price action techniques such as support and resistance levels can help day traders to ascertain when price is right or in spotting false moves.
Using VROC to detect support and resistance level failures
Knowing when a support or resistance level will hold or fail can give the day trader significant edge on the markets. Utilizing the information from volume, the VROC indicator can help traders to understand these market movements.
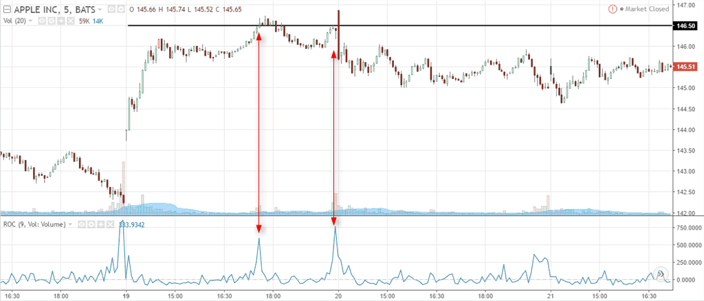
In the next chart below, we have the resistance level at $146.50.
VROC support and resistance analysis
Price already attempted to break past this resistance level briefly on a surge in volume and depicted by the VROC indicator. So, we know that resistance has been established. In the next instance we see price again attempting to break past this resistance level.
This time, the volume was even higher and suggested by the higher high formed in the VROC indicator. But this second attempt to breach the resistance level also failed.
Thereafter, price continues to push lower. The two instances gives day traders enough evidence that the resistance level at $146.50 will hold and indicators a downside move in price.
Using the VROC as a (volume) divergence indicator
The VROC indicator is also used to spot divergence.
When we talk about divergence here, we refer to the divergence between price and volume. The concept is somewhat similar to the previous example. The difference is that we look to the VROC indicator to see whether new highs in price are being validated by rise in the rate of change.
The concept of divergence with the VROC is similar to the type of divergence setups one can see with other indicators such as the relative strength index, the Stochastics oscillator or the MACD.
With the VROC indicator, we are only concerned with highs or lows in price. New highs and new lows must be validated by stronger volume and therefore by extension, higher spikes in the VROC indicator. Do not expect new lows to be validated by new lows in the VROC. Rather new lows in price should be validated by higher VROC levels.
When you see that the VROC is failing to confirm this phenomenon, you can expect price to make a short-term correction or even reverse the trend.
In conclusion, the VROC indicator is a volatility indicator that focuses on volume and not price. Therefore, the volume rate of change indicator is not to be confused with other volatility indicators such as Bollinger Bands.
Volume is an important piece to the puzzle when it comes to analyzing the stock or futures markets. Day traders who employ the volume aspect can get an edge over the others. The VROC indicator simply measures the rate of change in the current volume to the previous volume periods.
This can tell traders on how the volume is behaving. Day traders can then combine this information and analyze how the price of the stock is moving. Based on the above-mentioned examples, traders can use the VROC indicator in their technical analysis to build a full context of the security being traded.
Fans of the Tradingsim blog know that I am big on volume. Volume is probably one of the oldest off chart technical indicators you will find in technical analysis. So, as I’m looking through the...
3 Trading Indicators to Combine with the Klinger Oscillator
What is the Klinger Volume Oscillator? The Klinger Volume Oscillator (KVO or KO) is a volume-based indicator, which assists traders to identify a longer-term view of price trends. Since the KVO is a...
Parabolic SAR – Formula and Trading Examples with Multiple Timeframes
In this article, I will discuss several key things related to the Parabolic SAR indicator. The topics will range from how to compute the indicator, all the way to how to interpret buy and sell...


 Awesome Day Trading Strategies


