S&P 600 index is the little-known sibling of the S&P 500. However, unlike the S&P 500, the S&P 600 is less popular. The Standard and Poors 600 index, is the stock index that tracks 600 small-cap companies.
Small cap stocks or companies are those who have a market capitalization in the range of $250 million and up to 2 billion. One of the reasons why the S&P 600 is not that popular is due to the negative press such companies often receive.
There is a general misconception that trading small cap stocks are risky. Hence, most people prefer to stick to the larger indexes such as the S&P 500.
While this might be true, the fact remains that very often, some of the large-cap companies emerge from the shadows of the S&P 600.
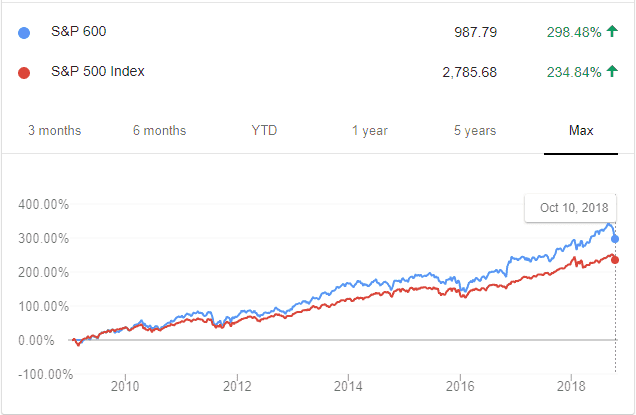
Comparison of the S&P 500 v/s S&P 600 index
Every so often, the Standard and Poors rebalance its indexes. During such times, companies are moved around. Some companies can get bumped off the S&P 500, while some manage to make it from the S&P 600 small-cap company stock index into the S&P500 large-cap stock index.
The S&P 600 index was launched in October 1984.
This press release gives one such example, where Chesapeake Energy Corp (CHK) was bumped off the S&P500 index to be replaced by Nektar Therapeutics (NKTR). As you can see from the example, the S&P 600 index is often updated to reflect the changing nature of the market capitalization of the companies that are listed.
While one might think that the S&P 600 index tracks the small-cap stocks, it also has competition. There are a lot of myths and misconceptions when it comes to small-cap stocks such as the S&P 600. In this article, we take a close look at what the S&P 600 index or the small-cap stock index is.
We also compare it with one of its closest competitors and show you ways on how you can get exposure to trading the S&P 600 small-cap stock index.
Difference between the Russell 2000 and the S&P 600 indexes
When it comes to small-cap indexes, most of the investors prefer the Russell 2000. The Russell 2000 index is another index that tracks the small cap markets. The index tracks the bottom 2000 stocks in the Russell 3000 index.
The Russell 2000 index is more famous because many mutual funds use it as a benchmark. Secondly, the Russell 2000 index is also widely quoted when comes to measuring the overall performance of the small-cap stocks.
Although both these indexes track the same market cap, the returns are quite different. See the chart below that compares the S&P 600 and the Russell 2000.
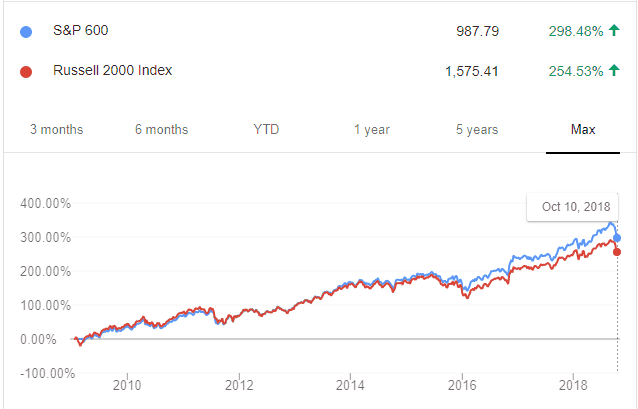
S&P 600 v/s Russell 2000 Index
Both the indices have had nearly similar gains since their respective inceptions and acceptance by the markets.
There is not much of difference as you can see. But if you look under the hood, the differences start to emerge. This article from the Financial Times looks at the subtle difference between these two small-cap stock indexes.
The article argues about how most of the companies in the Russell 2000 are unprofitable. Thus, it makes it easy for fund managers to beat the index to look good for its clients.
On the other hand, the S&P600 index is a lot more difficult to beat. This is due to the stringent requirements for companies. Companies listed in the S&P 600 must turn a profit in the aggregate in the last four quarters. The differences also come to the forefront.
In the article, an investment strategy notes that the S&P 600 index has a lead on the Russell 2000 when the U.S. economic outlook brightens. Therefore, when the overall health of the economy improves, investors need to look to the S&P 600 rather than the Russell 2000 index.
How are the S&P 600 index constituents selected?
The index is managed by Standard and Poors. The index tracks a broad range of companies in the small size sector. Not every company with the market cap can be listed into the index.
All companies in the S&P600 index are equally weighted, and the companies need to meet specific liquidity and stability requirements.
This criterion includes public float, market capitalization, and financial viability of the stock index to name a few. For a company to be listed in the S&P 600, the market cap for the S&P 600 index has to be between $450 million and $2.1 billion. Furthermore, the stock should not overlap with the S&P500 large-cap stock index or the S&P 400 mid-cap stock index.
Due to the market capitalization, you can see why the S&P 600 index is comparable to the Russell 200 index. Both these indexes measure the performance of the small-cap sector.
The S&P 600 is unique because it only tracks a certain aspect of the small-cap sector. By some estimates, the S&P 600 watches just three percent to four percent of the total investable equities in the United States.
This is because one of the requirements to be listed on the S&P600 is that a company must have some portion of its assets and revenues based in the United States. There is no requirement for the company’s assets and revenues to exceed 50%.
S&P 600 companies must also file annual 10-K reports and must trade on a U.S. stock exchange of course. Read this methodology report to learn more about the company requirements for an S&P 600 listing.
It helps you to understand the type of companies that are on the S&P 600, and this can be helpful when you want to invest or trade the S&P 600 index.
How to trade the S&P 600 index
As with any index, you cannot directly buy or sell the index. Several exchange-traded funds, futures, and other derivative contracts are the only means to gain exposure to the S&P 600.
As of September 2018, the S&P 600 index has 601 stocks that it tracks. The average capitalization of the index is about $1.36 billion. The top 10% of the S&P 600 index tend to influence about 5% of the movement in the index.
Some of the big names in the S&P 600 index include Interactive Brokers, Trex Co, Inogen Inc. Companies in the S&P 600 index are made up industrials which are 19.8% while communication services sector has a 2.1% portion in the index.
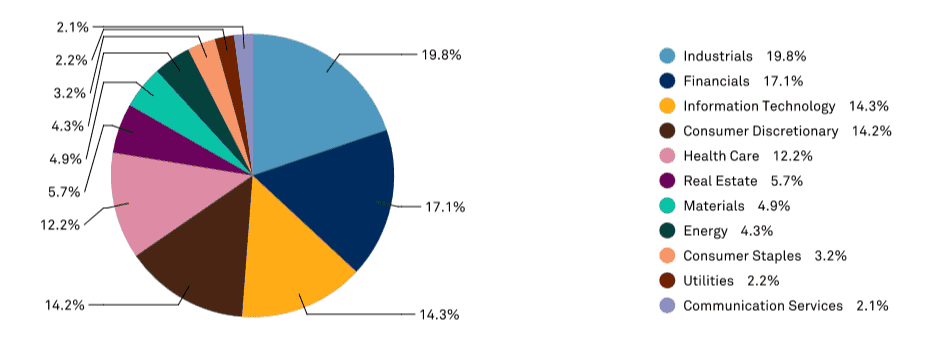
S&P 600 Sector breakdown
Some of the most active funds that you can trade are the Blackrock iShares index, State Street SPDR index, and the Vanguard index. Investors choose these funds as they offer massive upside potential. Many companies on the S&P 600 index leave as soon as there is a rebalancing done. Whenever there is an opening in the S&P 500 index, companies can quickly be elevated to the S&P 500 index. Mergers and acquisitions are also another aspect common to the S&P 600 companies.
Besides the exchange-traded funds, you can also trade the futures. The ES mini S&P 500 futures are of course the most popular. But you also have the small cap futures which track the underlying S&P 600 index. The construction of the futures contracts is pretty much the same.
Each contract unit is $100 x the S&P 600 index and settles quarterly. The minimum tick size is 0.5 points.
As you can see, the S&P 600 index is not that risky, and companies listed in this index tend to be one of the big performers with an aim to the move the large-cap listing.
S&P 600 index ETF – State Street Global SPDR SLY Index
The SLY exchange-traded fund is the S&P 600 small-cap index. The investment seeks to track the underlying index performance before fees and expenses. The fund invests 80% of its assets into the companies on the S&P 600 index.
The SLY ETF is quite young with an inception date of 2005 November. The valuation of its total assets under management (AUM) at $1.1 billion. Assets under management in ETF describes the amount of investor money the fund manages. Typically, the AUM is seen as a measure of how popular the fund is.
The ETF can also purchase a subset of the securities with generally the same risk and the return characteristics. The ETF is quite popular due to a combination of the fees, the holdings and the liquidity of the index.
On a year to date basis, the SLY ETF has a return of 14.5%. It has a beta of 1.02. Beta is a measure of the volatility of the index or the security. Typically, a beta of less than one means that the security or the index is less volatile than the market.
A beta of 1.02 means that the ETF (in this context) is 2% more volatile than the market. Now you get an idea of the volatility of the SLY ETF fund. The SLY ETF has an expense ratio of 0.15 percent.
Below is a comparative chart of the S&P600 index and the SLY ETF.
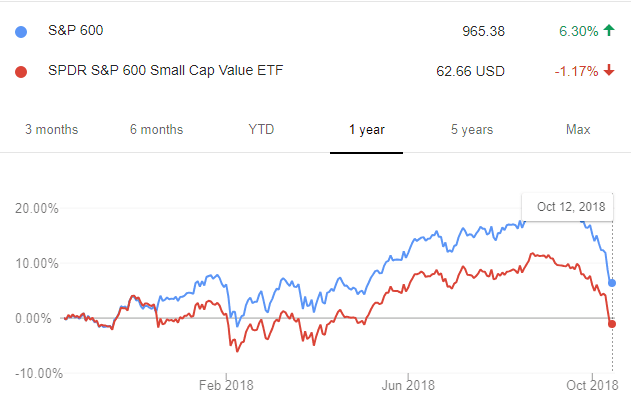
S&P 600 v/s SLY ETF
The above chart shows the comparison between the S&P 600 index and the SLY TF. You can see that on a one-year basis, the SLY ETF is down 1.17%, whereas the S&P 600 is up 6.30%. This is because of the beta in play.
Other Small Cap ETFs tracking the S&P 600
Besides the SLY ETF, there are many other exchange-traded funds that track the S&P 600 index. The iShares Core S&P small-cap index (IJR) is a close competitor. The IJR ETF boasts of a $30.5 billion assets under management with a cheaper expense ratio of 0.07%.
Another popular ETF is the Vanguard S&P 600 small-cap index (VIOO). This ETF has $688 million in assets under management with an expense ratio of 0.15%. Between SLY and the VIOO, the SLY beats regarding the assets under management.
And between the SLY and the IJR, of course, the IJR looks to be a better ETF to trade. However, differences in the assets the IJR holds and other reasons make the State Street’s SLY ETF the most popular among investors.
The IJR has a total of 602 holdings, whereas the SLY has 601. This is not much of a big difference. Even if you compare the yields between the two, it is barely negligible. The IJR has a yield of 1.41% while the SLY has a yield of 1.40%.
In a way, the IJR and the SLY small-cap ETFs come out neck to neck. Both these S&P 600 index ETFs have a narrower exposure. Hence, investors can pick one of the two or go deeper into the valuations to find the appropriate small cap ETF to invest in.
Why invest in the S&P 600 and small-cap ETF?
So far, we learned what the S&P 600 index is all about. We also cover the various ways you can gain exposure to the index, through ETFs or even futures contracts. Now let’s talk about the benefits of investing in a small cap index.
Without a doubt, the biggest selling point is that small-cap companies have large upside potential. Many successful companies of today were at one point an S&P 600 small-cap company. Although small-cap companies have immense upside potential, there are also some challenges.
Many companies on the S&P 600 index have small geographic footprints. What this means for the investor is that they are susceptible to the strength and weakness of the U.S. dollar. When the currency fluctuates, businesses can find a better deal to buy from abroad rather than domestically.
However, in the past year, things have changed a lot. The fiscal stimulus plan by President Trump which included cutting corporate tax has helped small-cap companies.
The table below shows the one-year historical returns of the S&P600 index.
| Year |
Beginning Price |
Ending Price |
Gain or Loss |
Percent Gain or Loss |
| 2008 |
395.14 |
268.73 |
-126.41 |
-31.99% |
| 2009 |
268.73 |
332.63 |
63.90 |
23.78% |
| 2010 |
332.63 |
415.73 |
93.10 |
27.99% |
| 2011 |
415.73 |
415.07 |
-0.66 |
-0.16% |
| 2012 |
415.07 |
476.57 |
61.50 |
14.82% |
| 2013 |
476.57 |
665.54 |
188.97 |
39.65% |
| 2014 |
665.54 |
695.08 |
29.54 |
4.44% |
| 2015 |
695.08 |
671.74 |
-23.34 |
-3.36% |
| 2016 |
671.74 |
837.96 |
166.22 |
24.74% |
| 2017 |
837.96 |
936.26 |
98.30 |
11.73% |
With the current U.S. economy experiencing a period of strong economic growth, the S&P 600 or the small-cap index is worth keeping an eye on.
Key Takeaways
- The S&P 600 tracks 600 U.S. small-cap companies, broadly those with market caps in the small-cap range (S&P updates its exact eligibility thresholds over time).
- Unlike the Russell 2000, the S&P 600 applies a profitability and eligibility screen, which has historically shaped its composition.
- Investors usually get exposure through ETFs that track the index rather than buying all 600 stocks directly.
- Small caps can be more volatile than large caps, which means more growth potential alongside more risk.
Frequently Asked Questions
What is the S&P 600 index?
The S&P 600 is a stock index that tracks 600 U.S. small-cap companies selected by S&P Dow Jones Indices. It is the small-cap counterpart to the better-known S&P 500.
What is the difference between the S&P 600 and the Russell 2000?
Both track U.S. small caps, but they use different methodologies. The S&P 600 applies eligibility rules including a profitability screen, while the Russell 2000 holds a larger number of constituents and rebalances on a different schedule.
How can you invest in the S&P 600?
Most investors gain exposure through ETFs that track the index. These funds aim to mirror the performance of the 600 underlying small-cap stocks without buying each one individually.
What size companies are in the S&P 600?
The index holds small-cap companies. The exact market-cap thresholds are set and periodically updated by S&P, so the cutoff for inclusion changes over time as the market grows.
Why do traders pay attention to small-cap indexes?
Small-cap indexes like the S&P 600 are often viewed as a read on domestic economic strength and risk appetite, since smaller companies tend to be more sensitive to the business cycle.
Related TradingSim Guides


 Swing Trading Strategies


