Dow Theory is one of the most basic concepts of analyzing the markets from a technical perspective. If one were to take any of the certified courses or exams as a technical analyst, a major portion of the exam covers the concepts of the Dow Theory.
Even if one is not interested in taking a course or getting certified, Dow Theory lays the foundations that helps traders (day traders as well) understand how prices move and why they behave the way they do.
Whether you are a day trader or a swing trader, if technical analysis is something that you swear by or talk about or use it in your trading, then it pays to understand what the Dow Theory is and what are the principles of Dow Theory to help get a better understanding of the markets.
Despite being published nearly a century ago, Dow Theory still forms the basis of technical analysis of the financial markets to this day. In fact some of the other widely followed concepts in trading such as Elliott Wave trading or Alan Andrews’ action-reaction median line finds its roots in the Dow Theory.
What is the Dow Theory?

Charles Dow
The Dow Theory or the Dow Jones Theory is a concept or a trading approach that was postulated by Charles Dow. The theory forms the basis for technical analysis in the financial markets today, spanning across OTC instruments such as Forex to futures and stocks.
The Dow Theory was a result of over 255 editorials from the Wall Street Journal that was written by Charles Dow. It was after Charles H. Dow’s death that Robert Rhea, George Schaefer and William Peter Hamilton compiled the editorials to form what we know of today as the Dow Theory.
Interestingly, Charles Dow himself never used the word Dow Theory.
Despite the fact that the Dow Theory was published around 1900’s, it is still widely used among technical analysis practitioners in the markets today stands testament to the validity of this rather important concept.
The Six Principles of the Dow Theory
The Dow Theory has six principles which when put together gives a complete picture for the markets. The six principles of the Dow Theory are:
1. The markets discount everything
This states the obvious fact that everything there is to know about the markets is already reflected on the security’s price. Based on this first principle, the price always reflects everything there is to know including expectations on the outcome of any future event such as interest rates or a stock’s earnings.
2. The markets have three trends
Dow postulated that the market trends can be classified into three trends, which are primary, secondary and minor. He defined an uptrend as one which has a consistent rising peaks and troughs while a downtrend is determined by falling or lower peaks and troughs.
Each of the three trends is also determined by their timeline. The primary trend usually lasts for more than year, while a secondary trend can be from a few weeks to a few months and finally the minor trend lasts for a few weeks.
This second principle from the Dow Theory is often said to have some correlation with the Elliott Wave theory.
Between the three trends, Dow notes that it is important to know what is the primary trend as it tends to impact the secondary and minor trends. The trends are also said to remain in place until a reversal is confirmed.
3. The market trends have three phases
Regardless of what trend the market is in, Dow says that the trends go through three main phases. These are, the accumulation phase, the public participation phase and the distribution phase.
In the accumulation phase, it is only the astute investors who know something about the security that they start to accumulate the stock. At this phase, the markets are typically ranging sideways. The accumulation phase usually occurs at the end of the downtrend or at a time when everything about the security looks to be bad for the stock price.
For informed investors, the accumulation phase is the best level as it offers the stock at a discount with most of the bad news eventually being discounted already. The accumulation phase is often the most difficult to spot as it could also mean a temporary pause before the previous downtrend resumes.
The public participation phase is where the trend ascertains itself and catches the attention of the general public or the technical analysts. Price advance is rapid in this stage and is lifted by the public participation buying into the rally.
From the stock’s perspective, the negativity associated with the stock starts to dissipate and thus the stock starts to rally on every piece of good news. The public participation phase is the longest of the three phases and is often the sharpest in terms of price movement.
Practitioners of Elliott Wave theory will find that the public participation phase is usually associated with the Wave 3, which is the strongest of the impulsive waves both in terms of duration and length.
The distribution phase is the final phase which forms the climax as the events are well popularized or talked about. The distribution phase is where the astute money managers start to offload their stock, but the general public is still unaware and continues buying in this phase which often comes before a trend reversal. The continued public buying in this phase continues to push the stock price higher (or lower) but can be associated with weaker volume levels (covered in point 5).
4. Averages must confirm to each other
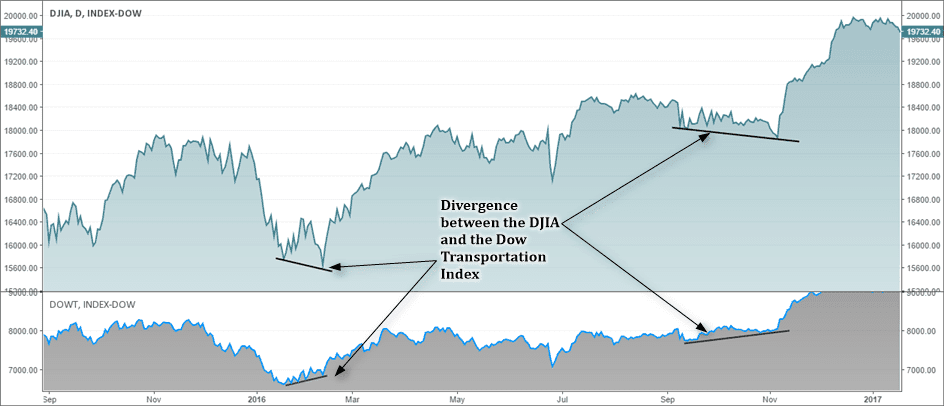
Under this principle, Dow states that unless the averages (Industrial and Railroad averages) confirm each other such as forming new highs together or new low together confirm the uptrend or a downtrend.

Dow Jones Averages Convergence & Divergence
Dow gave an example that when industrial production grows and more goods are produces, the railroad activity should also rise proportionately and when one of the two don’t match the level of activity, Dow said that the other index would also slow.
Thus, the Dow Theory notes that both the averages must confirm to each other when forming new highs or lows, although they don’t necessarily have to move in a lock step fashion.
Charles Dow’s averages principle is often said to have formed the basis for convergence and divergence in technical analysis. This is a common phenomenon which is used to capture turning points in prices when the price of a security does not confirm to an oscillator or another indicator.
5. Volumes must confirm the trend
Charles Dow considered volume to be a secondary indicator to price. According to Dow, volume must rise or fall when price in moving within the main trend with diminishing volume signaling a reversal in the trend.
Volume is an essential part of technical analysis, as pointed out during the three phases in the trend. Volume analysis also plays an important role when looking at other aspects of technical analysis such as chart patterns.
6. A trend is said to be continuous until a reversal is confirmed
According to this principle, Dow states that trend is actually one continuous movement and that unless there is some external force acted upon, the trend will not change.
This concept is similar to the principle of action and reaction in physics (and is also used in other technical analysis methods such as Andrews’ Pitchfork trading methods).
The Dow Theory Buy/Sell Signals
Ever since the Dow Theory was published, the markets have been flushed with various research and studies putting to test the principles of the Dow Theory. Alfred Cowles, was the first to publish his research in 1934 and in his study he showed that the Dow Theory offered lower returns compared to a traditional buy and hold portfolio.
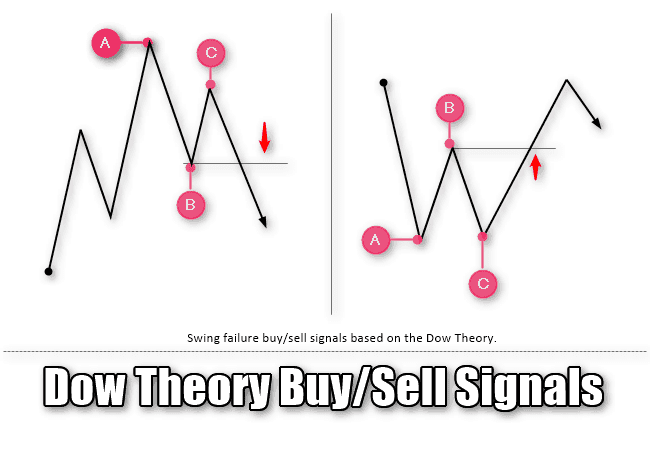
The Dow Theory signals are summarized as follows:
- Primary trend is interrupted by a secondary reaction which lasts on average of three weeks to a few months
- In a bull market, the secondary reaction is often a pullback following which there should be at least a 3% bounce in price on either the Dow Jones Industrials or the Dow Jones Transportation Index
- In a bear market, the secondary reaction is often a bounce after which the pullback must rise at least 3% on either the DJIA or the Dow Jones Transportation Index
- After the pullback, both the indices will fall below the previous pull back lows in a bull market or rise above the pull back highs in a bear market, which then qualifies it as a buy or a sell signal
- If the market reverses after a sell signal to reach new highs or lows on a buy on both the indices, then a reversal of the previous signal is warranted

Dow Theory Buy – Sell Signals
However, the study conducted by Cowles was dismissed by others in the field calling his work incomplete. The website, thedowtheory.com has been keeping track of the Buy/sell signals from the Dow Theory since 1953 and compounded, the method has generated 11.4%.
The Dow Theory buy/sell signals was able to beat the buy and hold portfolio, which has a compounded 10.6% return.
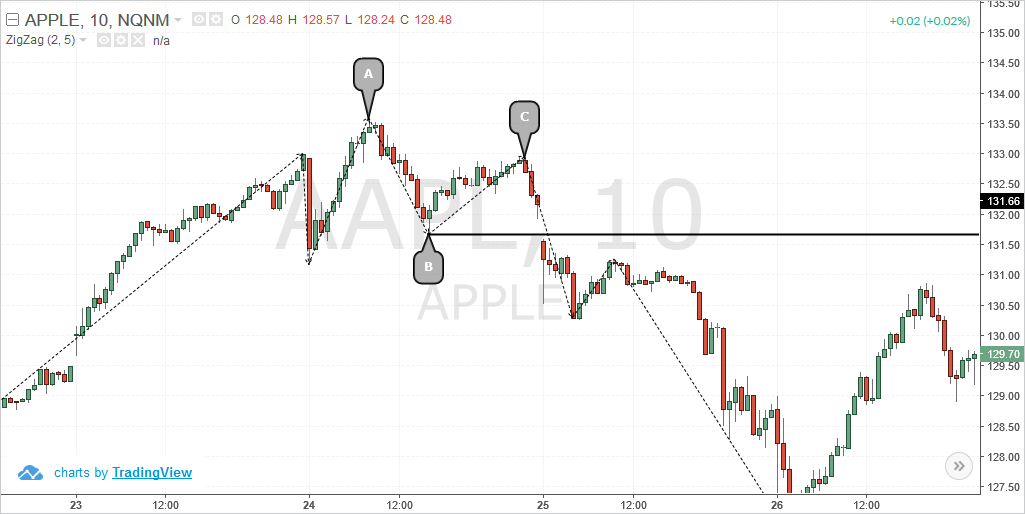
The Dow Theory method is mostly attributed to a long term trading strategy and is therefore irrelevant for day traders. While the Dow Theory is primarily used for long term investing, the concepts of it can no doubt be used as a trading method for day traders. This can be useful, especially when one looks at the swing failure method on an intraday time frame of trading.
The chart below gives an example of the swing failure method on the 10-minute chart time frame for AAPL. Here you can see how the A, B and C swing points are formed following which short position is triggered after the pivot low of B is breached on a lower high formed at C.

Dow Swing Failure Method on 10-min chart for AAPL
Day traders can also apply this same method on the intraday charts to trade long signals as well, on a swing failure low.
Most important concepts of Dow Theory for day traders
Regardless of whether one would like to believe or not on Dow Theory and its uses or adaption for day trading, there are some fundamentals of technical analysis that is defined in the Dow Theory that holds an important part for day traders.
Trends: Trends are the most important cornerstones of trading. Without knowing whether the market is in an uptrend, downtrend or ranging sideways it can be akin to driving in the blind.
Even the technical indicators such as moving averages, tend to focus on the concept of trends and visually depicts trends which in turn can help show the trader which way the primary market direction is in.
Closing prices: Closing price is one of the most essential data points in trading, not just for analyzing the markets but also in the way other technical indicators are built. While the Open/High/Low prices are also used, closing prices are more commonly used in trading and building the technical indicators.
From a price action perspective for day traders, closing prices can tell a lot about the market than the high, open or low prices for the day.
Volumes: For stock day traders, volume is an important aspect of trading and is often used to validate supply/demand or support and resistance levels. Even new highs are often confirmed with increasing volumes. For day traders, the importance of volume as postulated in Dow’s theory forms one of the key tools for day trading the markets.
Divergence and Convergence: Convergence and divergence is a concept that was made popular by the Dow Theory. Although the original concept of divergence and convergence was done based on comparing the Dow Jones Industrial Average with the Dow Jones Transportation Index, there are many variations of this applied to day trading systems now a days.
The most common way to ascertain divergence is to compare the (closing) prices in the security to an oscillator which is built based off the security’s price. When the oscillator fails to confirm the highs or lows in prices, the phenomenon is said to be a divergence which could signal a near term shift in the price direction.


