How to Forecast Market Direction Using the Russell 2000 Index
Jun 5, 2018
Written by: Al Hill
In this article we are going to cover methods you can use today to begin forecasting market direction with the Russell 2000 Index.
Before we dive into the meat of the article, for those of you unfamiliar with the Russell 2000, I will provide a brief overview to ground you on the Index.
The Russell 2000 Index is the list of small and mid-size companies from the United States.
For those of you that did not know, the Russell 2000 index is not managed by a US company, but is actually managed by the London based firm FTSE Russell, a subsidiary of the London Stock Exchange Group (LSE Group).
Another key fact about the Russell 2000 Index is that it is the bottom or smallest stocks in the Russell 3000 index.
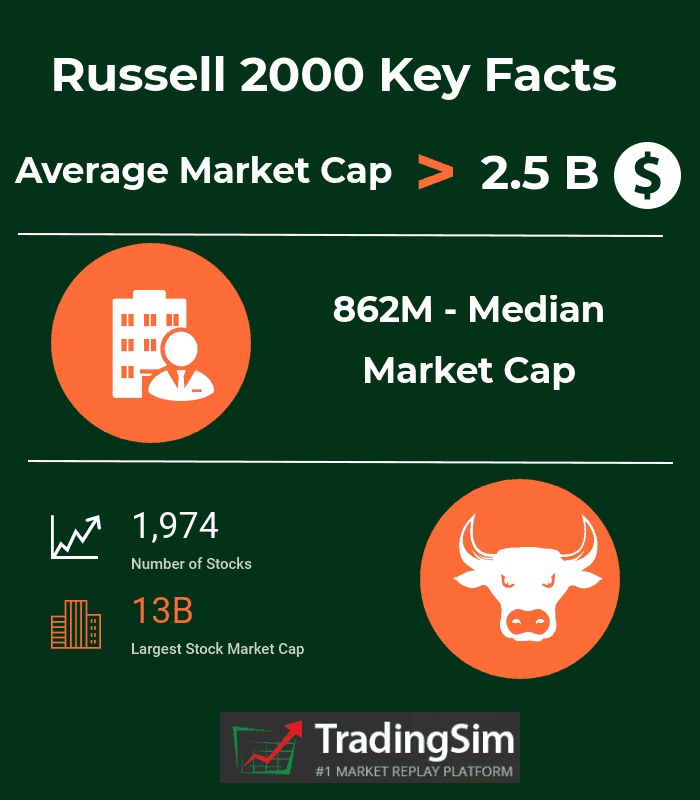
Here are a few additional key stats from the FTSE Russell as of April 30, 2018:
Russell 2000 Index Key Facts
The average market cap is 2.5 billion dollars
Median market cap is 862 million
Largest Stock Market Cap is 13 billion dollars
There are 1,974 stocks on the Index (not exactly 2000)
For more facts on the Russell 2000 Index, please visit the FTSE.com website and review their wealth of fact sheets (no pun intended).
In addition to these stats, what makes the Russell 2000 Index unique is the types of stocks that make up the 1,974 companies listed. Remember, small and mid-size companies are the engine that fuel growth.
No one expects the next technological innovation to come from IBM. It’s likely going to be some college kids in their garage thinking of some “crazy” idea.
Also, the Russell 2000 Index has stocks from all types of industries: retail, housing, technology, finance, etc. So again, more representative of the entire U.S. economy.
Lastly, the Russell 2000 Index value is weighted by the total number of shares outstanding by the price value of the stock. This is different than most other Indexes which base their value on the full market capitalization.
Why the Russel 2000 for Forecasting?
You can use any Index to try and gauge the direction of the market. However, I would much rather use the Index with a large number of healthy stocks to determine where things are going.
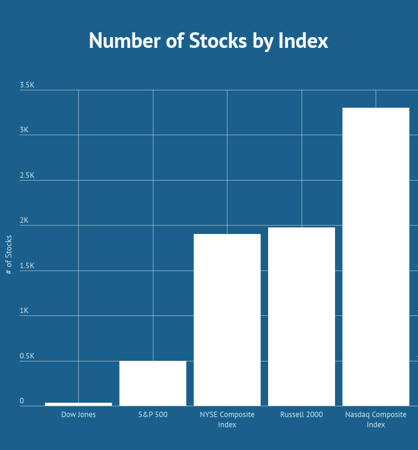
The below table illustrates the number of stocks for each of the major US Indexes.
Number of Stocks by Index
So this graphic clearly contradicts my point about the Russell 2000 having so many stocks, because the NYSE has just as many and the Nasdaq has more stocks listed.
The key difference which is not represented in this graphic is the Russell 2000 again has small and midcap stocks. The NYSE has mostly large companies and the Nasdaq is heavily weighted in the Technology space.
The ability for the Russell 2000 to cover a large breadth of stocks that haven’t hit “Too Big to Fail Status” is what gives the Russell its powerful forecasting abilities.
Now that you have an idea of the size and scope of the Russell 2000 Index, let’s talk about three methods you can use to forecast major market moves.
Strategy #1 – Locate Divergences of the Large Cap Indexes and the Russell 2000
For this first strategy, the first part of our hypothesis is that divergence between the Russell 2000 Index and other Indexes lead to changes in market trend.
Please do not interpret this to mean if the Russell 2000 Index is up at noon, then the Dow Jones is surely to follow suit by end of day.
Think of the leading indicator in the context of when major lows and highs present themselves in the market.
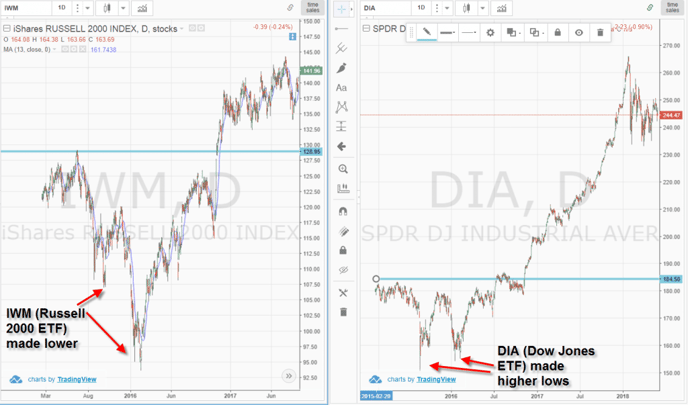
Instead of just reviewing the Russell Index, let’s take a look at the Russell ETF (IWM) since it mirrors the price action and you can actually purchase shares.
Russell 2000 and Dow Jones Price Divergence
The above charts are of the Russell 2000 ETF and the Dow Jones ETF from early 2016. Notice how the Russell 2000 continued pushing to new lows in mid-February, while the Dow Jones held up.
This was a clear sign that the market was not aligned.
Here comes the tricky part – you need to decide which way the market is going to break. From this example you can see that the bears were unable to keep the Index beneath its prior low. This bit of data in combination with the higher highs in the Dow Jones were your clues it was time to get long.
Strategy #2 – Trend Lines (Painfully Obvious)
Trading really isn’t that complicated. When you strip it down to the brass knuckles, tactics that worked 50 years ago are still in play today.
Now, I’m not talking about day trading techniques but the ability to identify major trends and forecasts in the market.
When it comes to identifying the direction of the market and its likely path going forward, trend lines are still at the top of the heap in terms of providing quality signals.
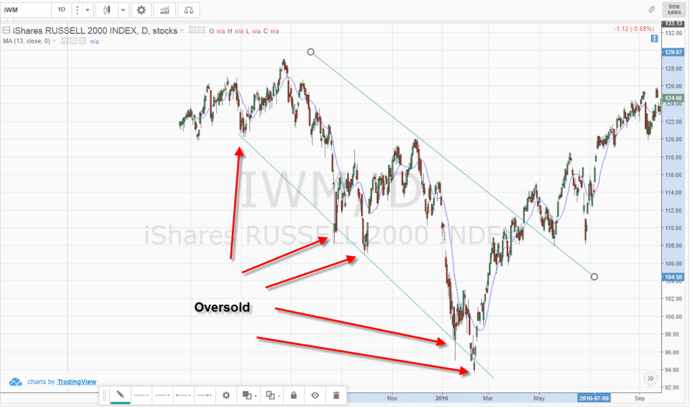
Let’s review the chart we used previously to identify the divergence between the Russell 2000 and the Dow Jones.
Russell 2000 Oversold – Trend Lines
As you can see from this image there was no need for fancy algorithms or complicated Fibonacci analysis. The Russell 2000 honored the support line while in a downtrend almost to the penny.
For those of you that think this was some sort of fluke, try explaining how the trend line was able to provide the support for almost 10 months. That’s more time than some people spend on a job.
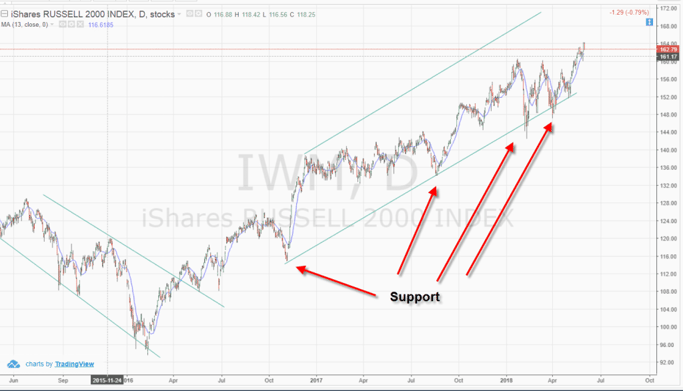
Still not a believer, let’s take a look at what happened after the Russell 2000 broke out of the down trend and how the index is trading up to today.
Russell 2000 Uptrend – Trend Lines
I’m pretty sure my first grader can draw that uptrend channel. It’s just too clean.
If there is any thought the trend was a fluke; well this time the trend has held for over 9 months and is still going strong today.
So, from the uptrend line and price action on this chart, where do you think the Russell 2000 will be headed in the next one to three months? That’s right – higher.
Strategy #3 – Keep an Eye on Mutual Fund Rotation
It’s wildly known in the trading community that mutual fund managers and hedge funds rotate between large and small cap stocks depending on market conditions.
To do this, we do not need a quant analyst.
All you need to do is track the percentage gain and loss for the Russell 2000 against the Dow Jones.
You want to identify when for example the Russell 2000 goes from underperforming the Dow to flipping to positive.
This is an indication that investors are now shifting funds away from blue chips and into small and mid-cap stocks. This generally occurs when fund managers are open to taking more risks in order to maximize returns for their clients.
This also can occur when market sentiment is overly bullish and all boats are rising.
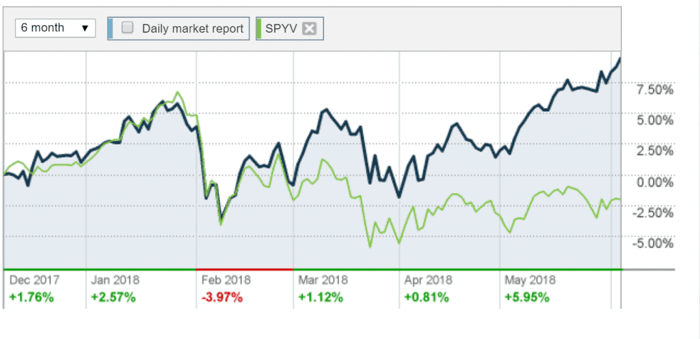
Russell 2000 versus S&P 500
These little blue and green lines hold a lot of truth to the trained eye.
The blue line represents the Russell 2000 and the green represents S&P 500 Value ETF.
Notice how the two Indexes were tracking closely to one another into early February. Then the Russell began to outperform the S&P 500.
The pullback in early April presented a great buying opportunity for entering into small and mid-cap stocks. As you can see the Russell has outperformed the S&P 500 by nearly 10%.
You will want to keep a close eye on the light green line. Once it crosses through the blue line, the smart money is now shifting funds back into the large cap plays.
In Summary
The Russell 2000 is an index and on many levels can act as a market breadth indicator to gauge the overall strength of the market. Even as an active trader you must keep an eye on the broad market in order to take a top down approach of (1) identifying the strongest markets, (2) finding the hottest stocks and (3) nailing the timing aspect of the trade.
Below is a quick recap of the three strategies:
You can use divergences between the Russell 2000 Index and other major Indexes to anticipate a change in trend
Trend lines don’t lie. Draw channels on daily and weekly charts to keep you on the right side of the market
Fund Rotation – keep an eye when money is flowing out of large cap and into small cap stocks. Once you see one improving relative to the other, it’s likely time ot shift your funds around.
Pre-Market Trading – How to Identify the Best Setups
You can check across the web and pretty much any source related to day trading will tell you that having a good pre-market trading strategy is a critical aspect of successful trading. But, how do you...
Bull Market Definition A bull market occurs when the market is expected to continue higher over an extended period of time. Bull markets are primarily described when discussing stocks, but it can be...
Illiquid Stocks – 4 Reasons You Should Not Trade Them
Illiquid stocks, as the name suggests, pertain to a certain set of stocks that have some common characteristic features. Illiquid stocks are those where the investor cannot easily liquidate the...


 Day Trading Basics


