Step-by-Step Guide to Trade the Rounding Bottom Pattern
Jul 26, 2016
Written by: Al Hill
The rounding bottom pattern is a technical setup for the patient trader. This is because the pattern can take quite a bit of time to develop before any significant price moves begin. In this article, we will walk you through a step-by-step guide for how to trade the pattern and the key things to look for as you manage your position.
The rounding bottom is a reversal chart pattern, which develops after a price decline.
As a stock is trending lower, the rate of the decline will begin to slow down. This is followed by a range pattern, which ultimately shifts into a slow gradual increase. This increase ultimately leads to a bullish move.
The pattern will appear symmetrical in nature when comparing the bearish and bullish sides of the formation.
Rounding Bottom
As you see, the price gradually switches from bearish to bullish. Note that this chart pattern could be found on any time chart. The pattern is truly relative to the time frame you are trading.
However, the one thing that each timeframe has in common is that the formation takes a lot of time to complete.
There are other chart patterns which are first cousins to the rounding bottom, such as the saucer bottom and half-pipe bottom pattern.
Volume Indicator on Rounding Bottom Pattern
Volume is a key indicator for identifying and validating the rounding bottom pattern.
The pattern will start with higher volume as the stock experiences its final plunge lower. This high volume event is then followed up with lower volume as the stock consolidates in a range. Lastly, the volume will begin to pick up again as the stock begins its bullish move higher.
Let’s now review the same chart, but now we will include the volume indicator:
Rounding Bottoms and Volume Indicator
The volume indicator is displayed at the bottom of the chart. As you can see in the formation, high volume in the beginning, flat in the middle and volume increase on the way out.
A simple method to visually validate the pattern is to draw a line connecting the tops of the volume indicator for each price period.
You will notice that volume will also mirror the same rounding pattern. Pretty cool uh?
Profit Target for the Rounding Bottom Formation
The potential of the rounding bottom chart pattern is bullish. After the trend switches from bearish to bullish, the expectation is for price to continue expanding higher.
But the question we all want answered is, how much higher? The simple answer is the move higher will be at least the size of the rounding bottom formation.
Rounding Bottom – Neck Line
To measure the potential of your rounding bottom, you should first identify the neck line of the pattern. To do this you should draw a line across the top of the bearish trend and the bullish trend before the breakout occurs.
Then take the distance between the neck line and the lowest point of the pattern. This distance is the size of the rounding bottom pattern.
When the price action breaks the neck line, you should open a long position.
The blue rectangles on the image illustrate the size and the target of the pattern. The green checkmark indicates the moment when the price action completes the minimum potential of the pattern.
The good thing about the rounding bottom pattern is that while it takes a long time to develop, it has a very high success rate.
It’s true that good things come to those who wait!
Step by Step Guide for How to Trade the Rounding Bottom Pattern
Now that you are familiar with the rounding bottom pattern, let’s do a deep dive on how to trade the pattern. In our walkthrough we will use the daily charts, but the same concepts will apply to any timeframe.
1) Confirming the Rounded Bottom Figure
To confirm the pattern, you need to find a price decrease, which slowly switches to a range followed by a price increase. The strongest confirmation comes when the volume indicator shows high volumes on the decline, flat volumes on the range and increasing volumes on the reversal.
2) Rounded Bottom Neck Line
After you identify the pattern, you need to draw the neck line. To do this, you need to draw a horizontal line across the top of the bearish and bullish sides of the rounding bottom pattern.
3) Rounded Bottom Breakout
The rounded bottom breakout happens when the price penetrates the neck line in a bullish direction. In simpler terms, the stock should show strength as it crosses through the neckline. This strength should display itself in the form of price expansion and increased volume.
4) Round Bottom Trade Entry
A trader should look to get long once the stock is able to break through the neckline.
5) Round Bottom Stop Loss
If you read the Tradingsim blog, you know I do not believe in trading without a stop loss.
Although the rounding bottom pattern is relatively reliable there are no exceptions to the rule of protecting your capital. After all, nothing is 100% in the stock market.
So, now that I have scared you to death, let’s talk about where to place your stop loss order. The answer to this question is in the midpoint of the pattern.
A more conservative approach would be below the low of the breakout candle. This way if the stock fails, you can quickly exit the position and look for better trading opportunities.
6) Rounding Bottom Target
The minimum target for the pattern is equal to the size of the pattern when added to the breakout. Once the price hits your target, you should look to exit the position.
Rounding Bottom Trading Example
Let’s now apply the 6 steps listed in a real-life trading example.
Rounding Bottom Trading Example
Above you see the daily chart of Coca-Cola from July through Oct, 2014. The image illustrates a rounding bottom trading example, where we go long on the breakout above $41.
First, the stock started with a gap down, which lead to a price decrease down to $39 dollars with high volume. The stock then traded sideways with a slight drop in volume. Coca-Cola then had a nice surge higher, which was the first indication that a bottom might be in place.
The price then retraced slightly lower, before creeping higher. This slow increase created the bullish side of the trend.
We then drew a neck line across the high of the pattern. Finally, and I say finally, because it took forever to form the formation – we enter a long position on a break of the trend line.
Now that we are in the trade, we need to determine the target of our position. Therefore, we measure and apply the distance between the neck line and the lowest point of the pattern.
We apply the size upwards starting from the moment of the neck line breakout.
The price starts increasing after we go long with Coca-Cola. Initially, the bullish trend is not that impulsive, but this is where you have to be confident in your analysis to hold onto the trade.
This patience would have paid off once the trend started shooting higher.
We then exited the trade once the price touched the high of the blue rectangle.
A Variation of the Rounding Bottom Pattern
One of the variations of the rounded bottom chart pattern is the cup and handle trading formation.
The cup and handle pattern has one slight deviation from the rounding bottom is that there is a slight decrease prior to the breakout.
Cup and Handle
The cup and handle pattern is essentially traded the same way as the rounding bottom. However, there are a few differences, which we will now discuss one-by-one:
There is a slight bearish pullback before the price breaks out.
The size of the pattern is the distance between the top of the handle and the bottom of the figure.
The pattern target is the size of the pattern applied from the moment of the breakout.
Your stop loss should be placed right below the lowest point of the handle.
Let’s now approach a real-trading example of the cup and handle pattern:
Real Life Cup and Handle Example
This is the daily chart of General Motors from April through May, 2016. The image illustrates a cup and handle pattern, which we traded to the upside.
The graph starts with a price decline during relatively high trading volumes. After this price decrease, the volume dried up and the stock went flat.
Then there is a slight up move higher, which looks like the stock is ready to breakout.
Suddenly, the price has a bearish correction, which creates a handle on the chart.
Once the stock breaks higher, we have confirmation that there was a handle and the stock shot up higher.
We place a stop loss order right below the lowest point of the handle as shown on the image.
The blue rectangles on the chart shows how we calculate the target for the trade.
We hold onto the trade until this target is reached.
Conclusion
The rounded bottom pattern represents gradual price shift from bearish to bullish.
The strongest confirmation of the pattern comes with the volume indicator. A valid rounding bottom starts with higher volumes during the decline, flat volumes during the range, and increasing volumes at the reversal.
The rounding bottom pattern has strong bullish potential. The expected price move equals the size of the pattern.
Although the pattern has a high success rate, it is relatively rare.
To trade the rounded bottom, you should follow these steps:
a) Identify a potential Rounded Bottom pattern.
b) Draw the Neck Line.
c) Confirm a Rounded Bottom breakout.
d) Enter a long trade on the breakout.
e) Put a stop loss in the middle of the pattern.
f) Stay in the trade for a price move equal to the size of the rounding bottom pattern.
A variation of the rounding bottom is the cup and handle chart pattern.
The cup with handle breakout appears when the price breaks the slight bearish pullback at the neckline.
The size of the pattern is the distance between the top of the handle and the bottom of the figure.
The pattern target is the size of the pattern applied from the moment of the breakout.
Your stop loss should be placed right below the lowest point of the handle.
Rectangle Pattern: 5 Steps for Day Trading the Formation
Today we will discuss one of the most popular continuation formations in trading – the rectangle pattern. How can something so basic as a rectangle be one of the most powerful chart formations? Well,...
The cup and handle pattern is one of the oldest chart patterns you will find in technical analysis. In my experience, it’s also one of the more reliable chart patterns, as it takes quite some time...
What is a Descending Top Pattern? Descending tops develop when the price action produces lower tops between swing lows. As the tops are lowering with each successive move, a bearish trend is forming...


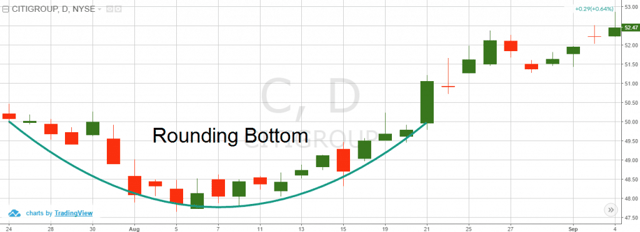
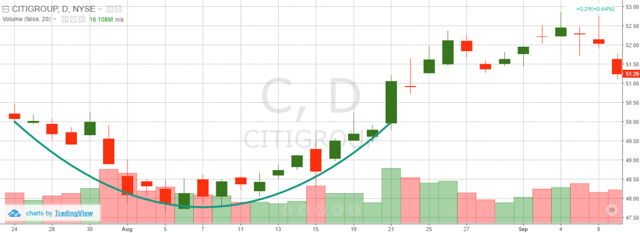
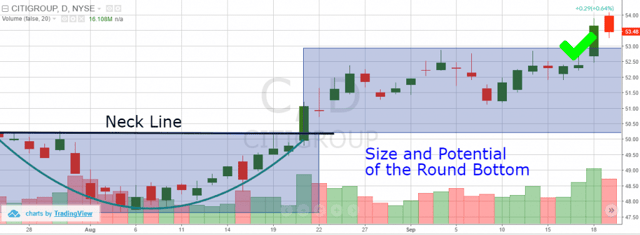

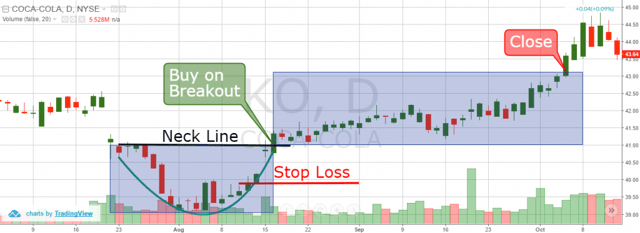

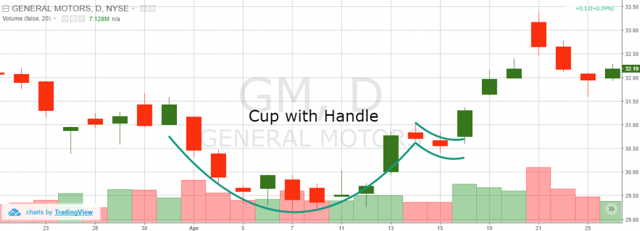
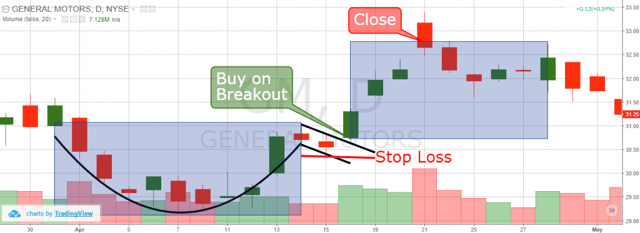


 Chart Patterns


