Have you ever heard of the RVI technical indicator?
I am not talking about the relative vigor index, termed RVI or RVGI. I am referencing the relative volatility index!
In this article, I am going to share with you how to use the relative volatility index in trading.
Relative Volatility Index Definition
The relative volatility index (RVI) was developed by Donald Dorsey, who truly understood that an indicator is not the holy grail of trading. The RVI is identical to the relative strength index, except it measures the standard deviation of high and low prices over a defined range of periods. The RVI can range from 0 to 100 and unlike many indicators that measure price movement, the RVI does an exceptional job of measuring market strength.
Purpose of Relative Volatility Index
The relative volatility index was designed not as a standalone indicator, but as a confirmation for trading signals. The RVI is most widely used in conjunction with moving average crossover signals.
Relative Volatility Index Buy and Sell Signals
Below are the rules that Dorsey developed for valid buy and sell signals when using the RVI:
- Buy if RVI > 50
- Sell if RVI < 50
- If you miss the first RVI buy signal buy when RVI > 60
- If you miss the first RVI Sell signal sell when RVI < 40
- Close a long position when the RVI falls below 40
- Close a short position when the RVI rises above 60
Using the Directional Relative Volatility Index Formula
Again, the relative volatility index indicator is not meant to be used as a standalone indicator for trading. Since the RVI is best suited for confirming trade signals, we should definitely combine the indicator with other trading tools and methodologies.
To this point, let’s now cover a number of approaches in further detail.

RVI and Fibonacci Retracement Levels
In this relative volatility index system, we are going to watch for potential Fibonacci retracement levels and trade bounces/breakouts that are confirmed by the RVI.
We will place our stop loss order at the next Fibonacci level, in order to limit or losses.
Lastly, we will use simple price action techniques to take profits (chart patterns, candle patterns, support and resistance, trends, etc.). We can also exit the trade based on a contrary signal from the relative volatility index indicator or from the Fibonacci levels.
The image below will show you how this trading strategy works:
RVI and Fibonacci Levels
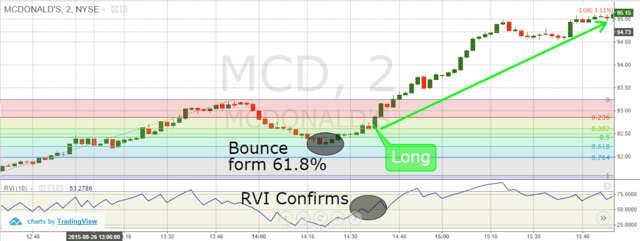
This is the 2-minute chart of McDonald’s from Aug 26, 2015. In the bottom of the image, you will see the relative volatility index indicator, which we use to confirm Fibonacci signals.
We have identified a trend and the corresponding 61.8% retracement of this price action. Then, we notice the price beginning to bounce in a bullish direction.
At this time, the relative volatility index indicator is still below the 50 level, but it quickly starts moving upwards. Seven periods after the bounce from the 61.8% retracement level, the RVI climbs above 50. This is our confirmation signal and we buy McDonald’s at $92.62. A stop loss order is then placed between the 61.8% and the 76.4% Fibonacci levels in the event McDonald’s loses steam.
After entering our trade, the next two candles are bullish and the price begins to expand rapidly as MCD approaches $95.
The next 3 to 4 candles begin to flatten out and we move our stop loss order to $94.50.
Ultimately, the price does not hit our stop and we exit the trade at $95.14, shortly before the market closes.
This trade accumulated profit of $2.52 per share while risking $0.52 (52 cents), thus representing a 1:5 risk-to-return ratio.
Let’s take a look at another trading strategy. This time, we focus our attention on Fibonacci breakouts and trend reversals.
Short – RVI and Fibonacci
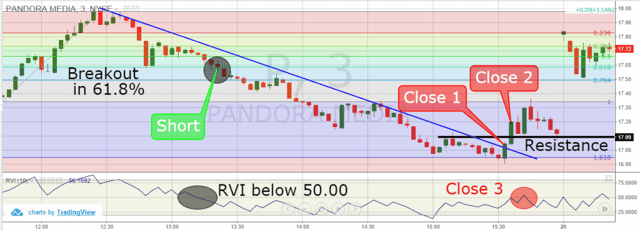
This is the 3-minute chart of Pandora Media from Aug 24, 2015. At the bottom of the chart, you will see the RVI indicator. On the left hand side of the chart, you see a bullish trend, which we have used to identify our Fibonacci retracement levels.
After reaching the psychological area of $18 per share, Pandora’s price starts to roll over and we believe this could be a great short opportunity, if Pandora breaks the 61.8% retracement level.
We follow the move down and open a short position once the 61.8% retracement level is broken and the RVI indicator breaches 50.
The price keeps decreasing afterwards and notice how the bearish move is nicely contained by the blue down trend line.
The price continues lower and ultimately breaks the 100% retracement level. The 100% retracement level is a potential reversal zone, so we keep a close eye on the trade. However, until the price breaches the blue line or the RVI closes above 50, we have no reason to exit our short position.
The price decrease continues downward until reaching the 161.8% Fibonacci extension level. Shortly after reaching the 161.8% level, the price breaks the trend line, the RVI closes above the 50 level and Pandora eclipses its most recent high. For all of these reasons, we exit our short position with a handsome profit.
Buying with the RVI and the ADX
This is a very interesting trade setup, which is a smart way of catching upcoming bullish moves.
It is very important to mention that the ADX indicator indicates trend strength and not direction.
Well, this is where the RVI comes into play. We will use the relative volatility index to determine if the stock is preparing to increase, as this strategy covers the long side of the trade. In other words, if the ADX is above 40 (or 50 if you want to get stronger confirmation), we will buy the security once the RVI also crosses above 50.
RVI and ADX
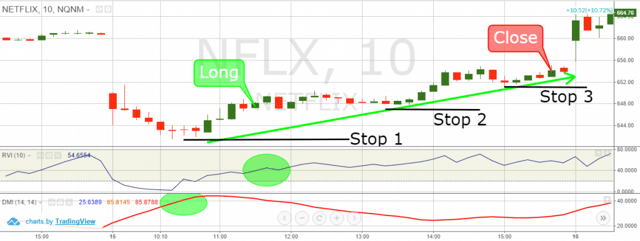
This is the 10-minute chart of Netflix from June 15, 2015. In the bottom of the chart, you see the relative volatility index and the average directional index.
First, the ADX crosses above 40, which gives us an indication that a strong trend is emerging. However, we don’t know the trend direction, because the price is moving upwards and the RVI is around 20, so we wait patiently.
Suddenly, the RVI switches above 50 and the price keeps its bullish pattern intact, while the ADX is still above 40, thus giving us our long signal. However, let’s not forget about our stop!
A great place for our stop loss order would be the area below the bottom formed at the beginning of the trend, which we have marked – stop 1.
Notice that the price starts to move higher and a bullish uptrend line is formed.
We take advantage of the trend line and adjust our stop loss orders to the tests of this trend line. As you can see, we adjust our stop loss three times in order to protect our gains as Netflix moves in our favor.
We exit the trade prior to the market closing in order to avoid overnight fees and the potential risk of a morning gap down.
This long trade on Netflix generated a profit of $6.00 per share.
Let’s now cover one more trading example.
RVI and ADX – Example 2
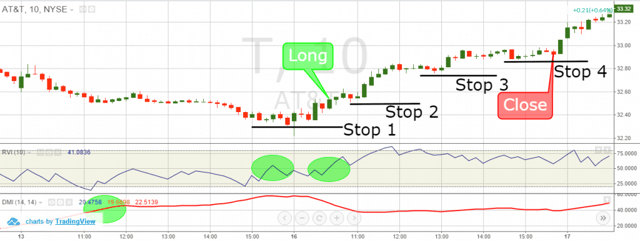
Above is the 10-minute chart of AT&T from Nov 15 – 16, 2015. At the bottom of the chart, we once again have the RVI and ADX indicators.
We are illustrating two days in this example, to further the point that at times you have to wait for multiple signals to line up before placing a trade. Trading isn’t always about taking action, sometimes the best course of action is just to sit tight.
Notice on the 15th, the ADX put up a strong reading, but the RVI is still below 50. Then the RVI finally crosses 50, but it’s with only 40 minutes left in the trading session, so we do not open a long position this late in the day.
The next day, the ADX is still above 40 and one hour after the market opens, the RVI switches above 50, providing a signal to buy AT&T. We go long and place our stop below the bottom of the prior the trend – stop 1.
After a two candle correction, the price continues increasing. This small correction creates a tiny bottom, which is a nice opportunity to adjust our stop loss order. We move the stop below the bottom of the trend line to lock in more profit – stop 2. A new price expansion appears followed by a correction. When the corrective move is finished, we adjust our stop below the bottom created by the correction – stop 3. There is one more price increase before the market closes, which allows us to adjust our stop yet again – stop 4.
During this trade, we generated profit of $0.40 (40 cents) per share, which equals 1.23% of profit.

Conclusion of How to Use the Relative Volatility Index
- The Relative Volatility Index calculation measures the standard deviation of price highs and lows.
- RVI is a confirmation indicator and it is not meant to be a standalone indicator.
- Relative Volatility Index signals:
- Buy above 50
- Sell below 50
- Close long trades when RVI falls below 40
- Close short trades when RVI goes above 60.
- RVI works nicely with Fibonacci retracement levels:
- Take into consideration only Fibonacci levels signals, which are confirmed by the RVI
- Exit trades based on price action.
- RVI also works nicely with the ADX when trading long positions:
- Buy on signal match from the RVI and the ADX
- Stay in the market until crucial support is broken, or until the RVI goes below 40
- Constantly adjust your stop Loss order according to the price action.


 Awesome Day Trading Strategies


