Pyramiding is an old trading strategy where a speculator adds to their position size by using margin from unrealized gains. This trading strategy is based solely on the power of using leverage and was made popular by one of the greatest traders of all-time, Jesse Livermore.
Example of Pyramid Strategy
A pyramiding strategy is considered a risky investment approach, but with proper money management can produce stellar results. Recently the market has taken a hard nose dive, with little or no retracements. If a trader was short, this kind of market environment would have been a prime candidate for a number or pyramiding strategies. In the below chart, Citigroup took a beating from a swing high of $49 in early October to a low of $3 in November. In a pyramiding strategy a trader will want to add to their positions on each bounce. So, in the below example when the stock fell from $49 and then had a short rally up to $35, this would represent a 29% drop, which on margin would be a 58% gain on your cash. This additional 29% of paper profits would then be used to add to the short position at $35 for the ride down. This process of adding to the short position would have continued all the way down to $3. Which would have produced much greater returns than simply shorting the stock at $45 and riding it down to $3.

Pyramiding Strategy
Pyramid Trading Rules
Now that you are familiar with the pyramid trading structures, let’s now do a deep dive of the trading rules around this strategy.
Entering a Pyramid Trade
When using the pyramid strategy, you should attempt to catch the trend right from its beginning. This is an extremely tall order as timing price moves is extremely difficult.
For this reason, I recommend you use another technical indicator to assist with entering the trade.
A good tool to assist you with the entry of your pyramid trades is the volume weighted moving average. Since the VWMA reacts to trading volumes, it will isolate false price fluctuations.
Therefore, you should enter a trade when the price breaks a bigger VWMA – 20 period or more.
Pyramiding – Taking Profits
Since we are going to use a VWMA to open the trade, we can also use the VWMA to determine where to take profits. Regardless of the number of pyramiding trades, they all should be closed when the price breaks the VWMA in the opposite direction.
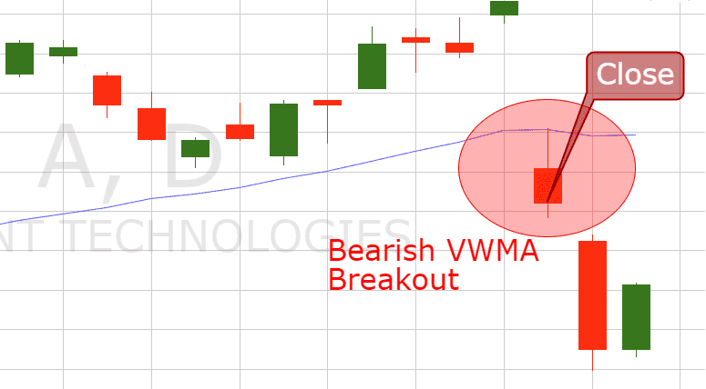
Bearish VWMA Breakout
The example above illustrates a bearish break down through a 30-period VWMA. If we were in a bullish trade, this bearish breakout would trigger us to close the position.
Since we will use the volume weighted moving average to determine when to exit our trades, the role of the stop loss order is not essential. Nevertheless, we will use a stop loss. The reason for this is to make sure we are protected from a rapid price move against our trade position.
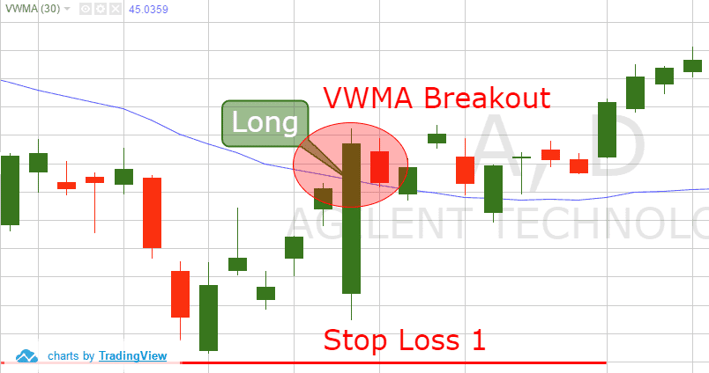
Stop Loss – Pyramid Trades
This is the same example from above. This time, after we enter the long position on the VWMA breakout, we place a stop loss below the bottom at the beginning of the trend.
You will use the same method for placing your stop on each subsequent price move.
Full Pyramid Trading Strategy
Now we will combine the rules from above into a full pyramid stock trading strategy. We will use a daily chart and enter trades when the price breaks a 30-period VWMA. A new trade should be added after each of the price’s corrections. Every trade we take should be protected with a stop, which should be located beyond the spike created after the correction. We will close all trades after the price breaks the 20-period volume weighted moving average.
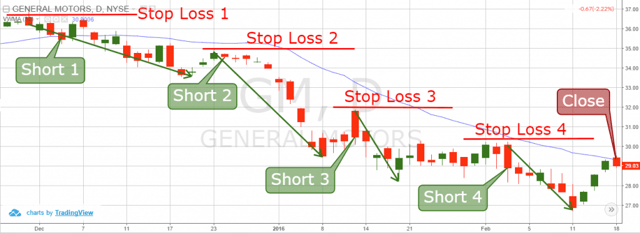
Pyramid Trading Strategy
Above is a daily chart of General Motors. The graph covers the period of Dec, 2015 – Feb, 2016. The image illustrates a pyramiding strategy.
The first trend impulse is located in the beginning of the chart. We short GM right after the price closes a candle below the 30-period VWMA. Concurrently, we place a stop loss above the top created as a result of the drop.
The price decreases further and gains distance from the 30-period VWMA. Later on, GM has a small corrective move. At the end of the correction, we open our second short trade and place a stop loss above the top created after the correction (Stop Loss 2).
The drop which appears is quite stronger than the previous trending impulse. After the correction, we open our third short trade. We place another stop loss above the top created after the correction.
Then another bearish impulse appears before the stock initiates a new correction. At the end of the corrective move we open the next short trade, placing another stop above the top created.
Now we have four short trades open, all supported by a single stop loss order, which protects the trades from rapid price moves in the opposite direction. After the fourth price impulse, GM stock enters a new correction and breaks the 30-period VWMA. This is the exit signal we need in order to close all four open positions.
The first trade generates the most profit, because it catches the whole trending move on the chart. Then comes the second and the third. The fourth trade brings a loss, which actually is insignificant, because we catch the trending move with the other three trades.
Let’s now go through the reversed pyramid trading approach. This is how pyramiding works when the stock is trending upwards.
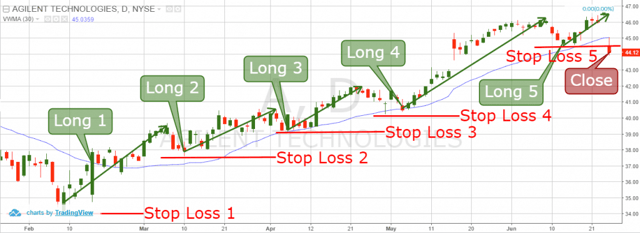
Long Pyramid Trading Strategy
You are now looking at the daily chart of Agilent Technologies from Feb – June, 2016. Above you see the pyramid strategy trading applied with five long trades.
It all starts when Agilent breaks the 30-period volume weighted moving average upwards. This gives us a long signal and we buy the stock as stated in our strategy.
We place a stop loss below the bottom, which initiates the beginning of the bullish trend. The price increase continues further and the stock gains distance from the VWMA.
A small correction and a new increase is the signal we need to open our second trade with Agilent Technologies. We place a stop for this trade right below the bottom created by the corrective move. Agilent creates a new trend impulse and the stock increases further.
The next correction brings the price to a test on the VWMA, but the level sustains the price action. This leads to a new bullish bounce, which is the premise for our third long trade with Agilent Technologies.
The price increases further, which leads to a new corrective move. The stock drops again to the 30-period VWMA for a test. Again, the level supports the price action and a fourth impulse appears on the chart. We go long with the bounce and we place a fourth stop loss order below the bottom between the correction and the new impulse.
The fourth move is the largest on the chart.
The price then drops to the 30-period VWMA for support test and bounces upwards. Therefore, we open a fifth long position. The stop loss of this trade is located below the bottom after the correction.
The price impulse is relatively smaller than the previous trending moves. The stock then gaps down and breaks the 30-period VWMA and our stop.
The fifth trade is considered a loser, since it broke our stop. However, the losses from it are insignificant. After all, we had 4 long pyramiding trades during a relatively strong bullish trend.
Negatives of Pyramiding
- Works only on trending market
Pyramiding will only work properly in a trending market. This is because if you are trading in a choppy market, the short-term corrections will naturally float towards previous swing points, thus eating into your original gains. So, remember to only consider such a trading strategy when both the markets and stocks are trending heavily in one direction.
- A big amount of used margin
Since the stock trading involves leverage in some cases, the pyramiding stock trading strategy hides a big risk. This risk is related directly with your trading bankroll. If you are not careful while implementing pyramid trading techniques, you could blow up your account quickly.
Next, I will list how this could actually happen in real-life:
A common leverage used by day traders is 4:1.
This means that if the trader bets “1” on a deal, he can profit as much as if he had invested “4” dollars.
Isn’t that great? Well, not entirely. The negative side of the leverage is that if you have placed “1” on a deal, you could also lose “4” if the market goes against you (leverage 4:1).
As you saw on the two examples above, pyramiding involves managing many trades at once.
Now imagine what happens if you have 5 open trades with a leverage equal to 4:1.
If you do not manage your bankroll properly, and the market goes against you, your free margin can easily go below the minimum maintenance level required from your broker.
If this happens, you will get a margin call from your broker. They will either ask you to fund your account with more cash, or they can just close your active trades in order to protect themselves.
Remember. the worst thing a stock trader could experience is a margin call from his broker.
Conclusion
- The pyramiding strategy is a technique where you add trades after each impulse during a trending move.
- At the end of the correction and the beginning of a new impulse, you should open another position.
- This rule is in force for every correction and new impulse.
- You should place a stop below the bottom of every correction.
- A good tool to support your pyramiding strategy is a volume weighted moving average.
- Hold all trades until the price action breaks the VWMA in the opposite direction of your trade.
- Pyramiding hides big risks for your bankroll because:
- It involves trading on margin.
- It involves many deals in the same stock.
- Pyramiding could easily lead to a margin call.


 Oscillator Indicators


