✓ Reviewed by Kunal Vakil, Co-Founder of TradingSim · Updated Mar 29, 2026
The price oscillator indicator displays the difference of two moving averages in either points or in percentages. This technical indicator is very similar to the MACD, but there are two main differences. (1) The trader can define any two input parameters for the periods of the moving averages, while the MACD is always 12 and 26. (2) The price oscillator indicator can be expressed in terms of percentages, so buy and sell signals can be generated as the price oscillator shifts from positive and negative territories.
Price Oscillator Formula
To plot the price oscillator indicator in terms of points use the below formula:
To plot the price oscillator indicator in terms of percentages use the below formula:
(Shorter Moving Average – Longer Moving Average)
——————————————————————- * 100
Longer Moving Average
Trading Methods
There are numerous trading methods for the price oscillator. Since the indicator is a trend following system, majority of traders follow a very simple rule of buying when the shorter average crosses above the longer average and conversely when the shorter average crosses below the longer average a sell signal is triggered. Another method is to fade the signals and go in the opposite direction. This generally works better in choppy markets, as the moving averages are not permitted to trend due to a range bound market.
Positives
As stated above, the price oscillator is a trend following indicator, so naturally the indicator works best in trending markets. Remember, that crosses in the moving averages will generate buy and sell signals, so in trending markets, there are few signals triggered, which allows a trader to maximize their gains, by riding the stock for big profits.
Negatives
Traders can find themselves in serious trouble with the price oscillator indicator when the market is choppy. For example, if a stock is trading within a range of $20 – $25 dollars, as the stock approaches $25, the shorter moving average will often close above the longer average due to the upward move in price. To the detriment of the trader, the range will provide resistance at the $25 level and the stock will once again head lower. Depending on the traders stop loss strategy, at a minimum this situation will cause a number of false signals and losing trades.
Price Oscillator Charting Example
Price Oscillator
Price Oscillator Divergence
Like other indicators, the price oscillator also exhibits divergences on both the bullish and bearish side.
Bullish Price Oscillator Divergence
The bullish price oscillator divergence occurs when the price on the chart is decreasing, while the indicator line is increasing. This is likely to cause a rapid reversal on the chart followed by a bullish extension.
Bearish Price Oscillator Divergence
As you probably guess the bearish price oscillator divergence is opposite to the bullish one. It happens when the price action is increasing, while the PO line is decreasing. This event is likely to lead to a rapid reversal on the chart, followed by a bearish extension.
This is what the price oscillator divergence looks like on the chart:
Price Oscillator
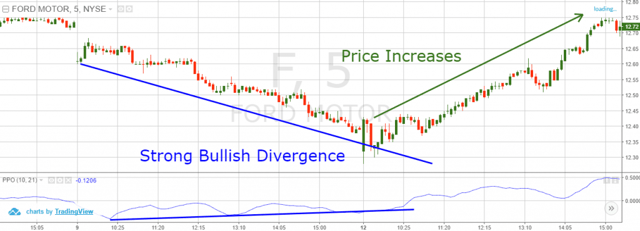
Above you see a classical example of a bullish divergence between the PO indicator and the price action. See that the price is following a strict bearish trend. At the same time, the price oscillator indicator line is making higher bottoms. This confirms the presence of the bullish divergence on the chart. As you see, the price then reverses and enters a bullish trend, which is even sharper.
The bearish divergence works the same way, but in the opposite direction.
3 Strategies Using the Price Oscillator Technical Indicator
Now that you are pretty familiar with the structure of the PO indicator, we will discuss three trading strategies.
One method for using the price oscillator indicator is by combining it with candlestick patterns. This means that we will take into consideration only crosses of the zero line supported by a candle pattern in the same direction.
Imagine a stock is trending downwards. Suddenly, the PO indicator creates a bullish crossover at the zero line. At the same time, the bearish price action creates a reversal candle pattern. If the pattern is confirmed, you will have a strong bullish signal from both indicators.
You should trade this setup in the bullish direction, placing a stop at the other side of the pattern.
Then you should trade until you get an opposite signal from the price oscillator indicator, or until the price action tells you otherwise.
It works the same way in bearish direction, or when trading price oscillator divergence.
Now let’s approach a real trading example with the price oscillator indicator and a candlestick pattern:
Price Oscillator and Candlesticks
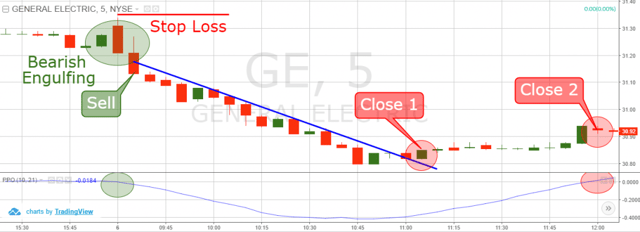
Above you see the 5-minute chart of General Electric from September 6th, 2016. The image illustrates a bearish price oscillator trade supported by a bearish candlestick pattern.
The image starts with the PO indicator crawling around the zero level without making a move. Suddenly, on September 6th, a bearish engulfing pattern develops.
At the same time, the price oscillator indicator begins to trend below the zero level.
This gives us two matching bearish signals and we open a short trade.
We place a stop loss order above the highest point of the pattern. This way our trade is protected from any unexpected movement.
As you see, the price action enters a bearish trend afterwards. The trend is so consistent, that we can measure it with a bearish trend line.
According to our strategy we need to exit the trade the moment the price action breaks the trend. This is shown in the red circle and the sign “Close 1”. We get a price action signal in a bullish direction, which forces us to close the deal.
The other exit opportunity comes when the price oscillator indicator breaks the zero level upwards. This creates an opposite signal on the chart, shown in the other red circle with the sign “Close 2”. Of course, the first closing alternative is the better one since the price is lower.
#2 – Price Oscillator + 50-Period TEMA
The triple exponential moving average (TEMA) is another tool you can combine with the PO indicator.
The TEMA is a moving average indicator; however, the moving averages are exponential.
In this manner, the TEMA shows the same perspective on the chart, but looked through the angle of an EMA. For this reason, matching signals between the two tools create strong signals on the chart.
In order to provide more accurate signals, the TEMA needs to be slowed down a bit, so it can mirror the number of trade signals of the PO. For this reason, we will change the value of the triple EMA line to 50-periods.
We will enter trades only when matching signals occur on the chart. At the same time, we will stay in our trades until the PO line creates an opposite signal.
Although we will close our trades only based on PO signals, we will use a stop loss order. This way we will protect our trades against high volatility moves against our position. The stop loss order should be placed beyond a top/bottom created prior to the signals.
Let me now show you how exactly this strategy works.
Price Oscillator and TEMA
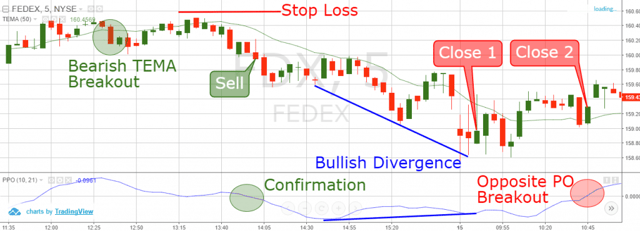
Now we are looking at the 5-minute chart of FedEx from Sep 14, 2016. We have the PO tool at the bottom of the chart and a green 50-period TEMA line. The case illustrates the harmony between the TEMA and the PO indicators.
It all starts when the price action creates a bearish breakout through the green TEMA line. This gives us a signal that the price might enter a bearish trend. But we still don’t have a bearish signal from the PO indicator.
The signal develops 17 periods later. The price oscillator indicator line breaks the zero level downwards, giving us a bearish signal.
Now we have a bearish signal from each of these two indicators. Thus, we sell FDX and we place a stop above the most recent top as shown on the image.
See that the price enters a bearish trend afterwards. At the same time, the TEMA line works as a resistance. The FDX price action reaches the area around the TEMA and it then bounces lower. See that a breakthrough the TEMA line appears at one point. Yet, we hold the trade until the PO gives an opposite signal as stated in our strategy.
The price keeps decreasing; however, the PO indicator accounts for higher bottoms (blue lines). This creates a bullish divergence on the chart. You can use this signal to close your trade (Close 1).
If you don’t manage to see the divergence on time, you can hold until the PO crosses the zero line. This happens in the moment indicated with “Close 2”.
#3 – Price Oscillator + Volume Indicator
The last tool we will use with the PO is volume.
The volume indicator is a good way to confirm any signal on the chart. The best thing is that it is pretty easy to understand and use. The rules are simple; if a lot of people are in the market, the price is likely to enter a trend. If not many people are in the market, the price action is not likely to be persuasive. In other words, higher volumes lead to trends while low volumes stay range bound.
What we will do here is to trade only price oscillator signals, which appear during high or increasing volumes. This would mean that the price action is likely to start moving in the direction of the trade signal.
Contrary to this, we will avoid PO signals during low volumes. The reason for this is that lower volumes imply that the PO signal is more likely to be false.
To position your stop loss orders, you need to use some price action techniques. We will place our stops beyond tops and bottoms created prior to the signal.
To exit our trades, we will keep an eye out for decreasing volumes on the chart.
When volumes are decreasing, the trend is likely to slow down too. In this manner, we can observe the volumes effect on price. When you see the volumes getting lower and price hesitating, then the trade needs to be closed. This profit taking approach can be tricky at times.
Let’s now move on to a real trading example with the price oscillator indicator and the volume indicator:
Price Oscillator and Stop Loss
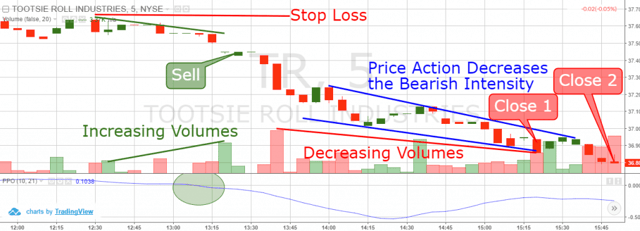
You are now looking at the 5-minute chart of Tootsie Roll Industries from September 9th, 2016. Our graph now includes the volume Indicator above the price oscillator.
The chart begins with a range, which grows into a decrease. At the same time, the volume indicator is increasing in volume.
Meanwhile, the PO breaks the zero level downwards. These three events on the chart tell us that the price action is probably entering a bearish trend. Thus, we sell the TR security.
Then we place our stop loss order to protect our trade from unexpected events on the chart. The stop is located above the high prior the price decrease as shown on the image.
See that the TR price decreases afterwards. Meanwhile, we get another volume bar which is even bigger than the previous three. This supports the theory that the trend is currently bearish.
Sadly, the next bigger volume bar is lower than the previous one. At the same time, the price action on the chart slows down. The bearish intensity seems to be decreased (blue). Then we get another bigger volume candle, which is even lower. This way we account the decreasing volumes with the TR stock.
This is a very good place to exit the short trade with Tootsie Roll Industries (Close 1). But, the markets are about to close 30 minutes later. If you choose to hold the trade, you can use the “Close 2” option, which is situated in the last period prior the market closing.
I advise you to stick with the “Close 1” alternative here as stated in our strategy. After all, you won’t be that lucky every time to get your exit signal right prior to the market closing.
Which is the Best Price Oscillator Strategy?
My personal preference supports the volume indicator as the best tool to combine with the PO. The reason for this is hidden in the essence of volumes in trading. The better you read the volumes, the less false signals you will get on the chart.
The TEMA could also be a very efficient tool when combined with the price oscillator indicator. However, the TEMA is relatively dynamic, no matter how high you adjust the indicator. Thus, the TEMA could give you a relatively large number of fake entry signals.
Candlestick patterns are also an excellent way to confirm signals on the chart.
Conclusion
The Price Oscillator is a technical indicator, which represents the price difference between two custom SMAs.
The indicator consists of a single line, which bounces above and below a zero level.
The PO formula takes the smaller SMA and subtracts the bigger SMA from it, giving a value.
The basic price oscillator signals are:
PO line switches above 0.00 – Long Signal
PO line switches below 0.00 – Short Signal
Bullish PO Divergence – Long Signal
Bearish PO Divergence- Short Signal
Three of the strategies to successfully use the Price Oscillator Indicator use the following tools:
Candlestick Patterns
Tripe Exponential Moving Average
Volume Indicator
The best alternative out of these three options is the Volume Indicator because:
High volumes confirm well the entry signals generated by the price oscillator indicator.
Low volumes hint that the trend is being exhausted.
Alton Hill is the Co-Founder of TradingSim with over 18 years of trading experience. He completed the Design Thinking Bootcamp at Stanford’s D.School and brings expertise in Product Development to create the best trading simulation experience. His strategy focuses on trend-following systems, targeting high-volatility stocks with strong primary trends using the 15-minute chart.
Fan Principle Definition The fan principle is based on the use of multiple trend lines to judge a major reversal in the market. The fan principle on first glance looks very busy on the chart, but it...
In this article, I am going to cover some basic trading techniques you can use with the Bollinger band widthwidth indicator. Before we dive into the strategies, let’s first discuss the indicator....
What is Pyramiding? Pyramiding is an old trading strategy where a speculator adds to their position size by using margin from unrealized gains. This trading strategy is based solely on the power of...


 Overlay Indicators


