✓ Reviewed by Kunal Vakil, Co-Founder of TradingSim · Updated Mar 29, 2026
If you have been day trading with price action and volume – two of our favorite tools – then the money flow index (MFI) indicator would not feel alien to you. Once you move past the fancy name, the money flow technical indicator essentially acts as a momentum oscillator that calculates the volume and price data in order to measure buying and selling pressure.
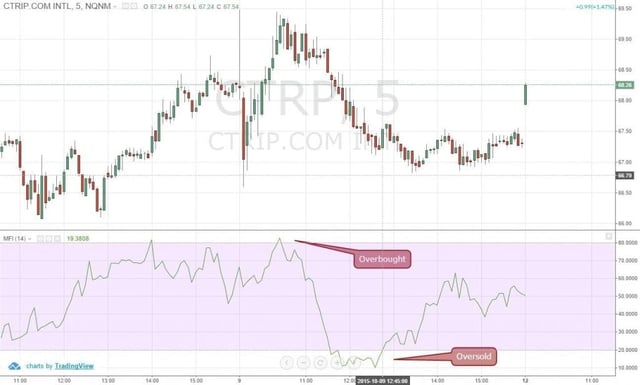
By calculating the indexed value based on the stock price and volume of the number of bars specified in the money flow index settings, it plots a line on the chart that oscillates between the 0 and 100 level.
Figure 1: Money Flow Index of CTRP Fluctuating Between the 0 and 100 Levels
When a stock’s price rises, the money flow index indicator also rises and is a sign of increased buying pressure. Conversely, if the stock price drops, the money flow index indicator will also decline and is a sign of selling pressure. Therefore, you can easily predict the directional momentum in the market by keeping an eye on the money flow index.
Although you do not need to calculate the money flow index indicator by hand to effectively use this indicator for day trading, it is always a good idea to fully understand the formula of an indicator prior to applying it in live trading.
In order to calculate the money flow index indicator, you need to go through four steps.
Step # 1: You Need to Calculate the Typical Price of the Stock
You can calculate the typical price of any time frame by calculating the average of the high, low and the closing price.
Therefore, the formula for calculating the typical price of the stock would be:
High of the Bar + Low of the Bar + Closing Price of the Bar ÷ 3
Step # 2: You Need to Calculate the Money Flow
You can easily calculate the money flow by multiplying the typical price of a time frame by the volume of the stock during that time frame. Therefore, if you are calculating the money flow of a daily bar, all you need to do is multiply the typical price found in step # 1 by the daily volume. Similarly, if you are calculating the money flow of a 5-minute bar when day trading, you simply take the price of the 5-minute bar and multiply it by the volume generated within that time frame. Simple!
Money Flow = Typical Price x Volume
In order to plug the money flow into the money flow index formula, later on, you also need to find the positive and negative money flow. The rule of thumb is:
If you add all the money flow from the time frames where the typical price was higher compared to the previous bar, then you would end up with a positive money flow
If you add all the money flow from the time frames where the typical price was lower compared to the previous bar, then you would end up with a negative money flow
So, if you have 14 periods in the money flow settings, you need to look for bars that have a price higher than the previous bar to find positive money flow. On the other hand, to find the negative money flow, you need to look for all the bars that had a typical price lower than the previous bar.
You might be wondering what should you do if the typical price remains the same compared to the previous bar? Well, just ignore that bar and move on!
If you have any confusion regarding this step, feel free to leave us a comment below and we would be happy to help you answer any questions.
Step # 3: You Need to Calculate the Money Ratio
You can calculate the money ratio with another simple formula:
Money Ratio = Positive Money Flow ÷ Negative Money Flow
By now, you should be able to guess that if the money ratio exceeds 1, the stock has a bullish sentiment, right? If you understand everything up to # 3, you have pretty much figured out how the money flow index indicator works. But, there is one last step!
Step # 4: You Need to Calculate the Money Flow Index (Finally!)
The last calculation you need to perform would lead you to the actual money Flow Index. The formula for the money flow Index is the following:
Money Flow Index = 100 – (100 ÷ (1 + Money Ratio)
As you can see, the money flow index essentially shows the percentage of positive money flow compared to the total money flow.
How Can You Apply the Money Flow Index Indicator in Trading?
If you have traded the relative strength indicator (RSI), then you would not have much trouble incorporating the money flow index indicator into your day trading. This is because the money flow index indicator also fluctuates between 0 and 100, as discussed above.
Now, if you find the money flow index reading is above 80, you should be very cautious about the uptrend as anything around level 80 indicates an overbought market condition where the price may start a short-term counter move or retracement.
By contrast, when you find the money flow index reading below 20, you should start to reduce your short exposure as it indicates the stock is oversold and the price will likely increase.
Since the money flow index indicator is a momentum oscillator, you use this to confirm the price action. If the money flow index is declining and your trading system generates a sell signal, the odds of the stock price going down would be much higher. Similarly, you can utilize the money flow index indicator for taking a long position when the money flow index chart is going up.
There is another way you can use the money flow index indicator, and that is as a divergence signal. If you find that the stock price is going up, but the money flow index indicator is declining, it would provide insight that the uptrend is weak and should not be trusted. A divergence like this indicates that the stock price would likely start a correction phase. You can apply the same divergence strategy when the price is falling, but the money flow index is rising.
Money Flow Index Example Trade # 1: Buying an Oversold Stock
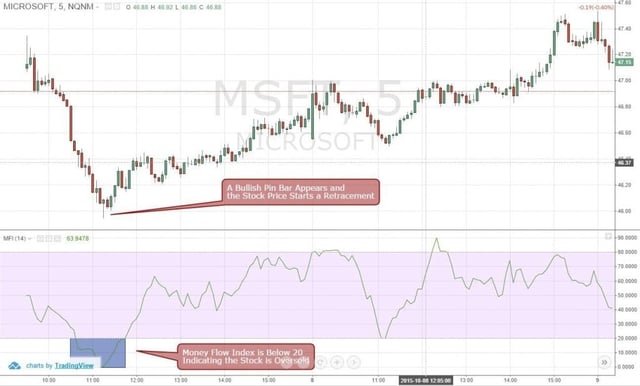
Figure 2: Money Flow Index Is Showing Oversold MSFT
In figure 2, you can see that the MSFT price is oversold and indicating a potential retracement. All of a sudden, a bullish price action bar (pin bar) appears on the 5-minute chart and the MSFT price begins to increase. If you had the money flow index indicator on your chart, you would have been already anticipating a retracement and by combining price action, you could have easily placed a BUY order with confidence.
Money Flow Index Example Trade # 2: Selling an Overbought Stock
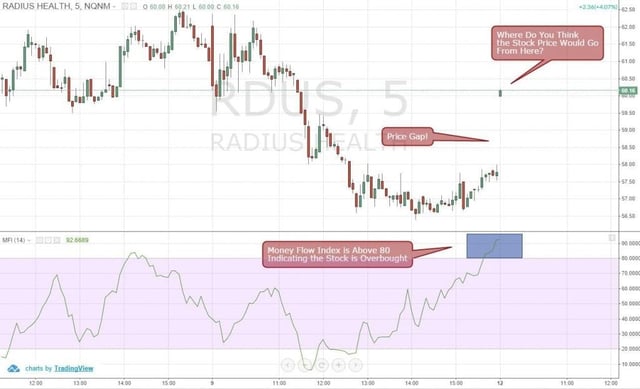
Figure 3: Money Flow Index Is Showing Overbought RDUS
In Figure 3, you can see that the RDUS price had a huge gap and the money flow index reading was above 80. If you have read this article from the beginning and understand how to use the money flow index trading strategy, you should be able to identify that this is a great opportunity to sell the stock, right?
Money Flow Index Example Trade # 3: Spotting a Money Flow Index Divergence
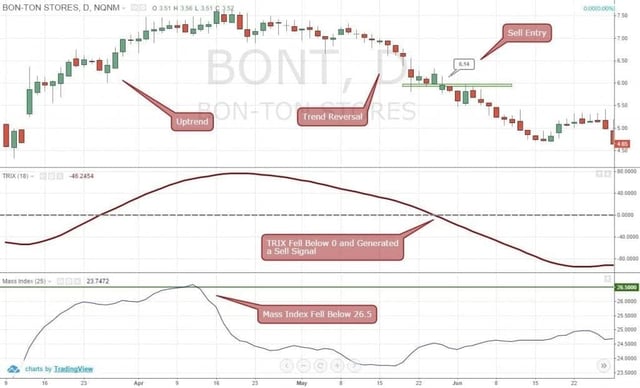
Figure 4: Money Flow Index Showing Divergence
As we discussed earlier, the money flow index can be a great tool to identify divergence in the market. In the same RDUS chart, you can see that the stock was showing a bearish divergence after the money flow index reading went above 80. As a result, the RDUS price soon not only started a retracement, the uptrend actually turned into a downtrend.
Conclusion
If you are familiar with the relative strength indicator formula, you might have realized by now that the money flow index simply incorporates the ratio of positive and negative money flow into the RSI. This is why some professional traders refer to the money flow index indicator as the volume-weighted RSI.
Since the money flow index trading strategy incorporates not only price, but also volume, it is often really good at picking tops and bottoms in the market.
Alton Hill is the Co-Founder of TradingSim with over 18 years of trading experience. He completed the Design Thinking Bootcamp at Stanford’s D.School and brings expertise in Product Development to create the best trading simulation experience. His strategy focuses on trend-following systems, targeting high-volatility stocks with strong primary trends using the 15-minute chart.
Best 3 Day Trading Indicators – On and Off Chart [Video]
Day Trading Indicators Video Before we dive into day trading indicators, first review the below video which is a nice primer. Click for sound 12:39 When you are just starting in day trading, you will...
choppiness indicator Wouldn’t we all love to know when a stock is trending and when it is in flat territory? Close your eyes for a second and imagine a world where you know on the first tick that the...
2 Simple Strategies for Trading with the Chaikin Money Flow Indicator
Chaikin Money Flow Indicator Review Chaikin Money Flow Index Illustrated above is a zoomed in screenshot of the Chaikin Money Flow (CMF) index from the Tradingsim platform. As you can see, the...


 Day Trading Indicators


