We have all likely seen Level 1 data at some point or another while trading. It’s the little window in that widget on your screen that shows where people are willing to buy and sell.
But is this data beneficial? What are we to do with Level 1 data when day trading or swing trading?
Well in this post, we will relay to you how to trade with Level 1. More importantly, we will answer the question of what’s different between Level 1 and Level 2.
What is Level 1?
Level 1 quotes are standard with most online day trading applications for free or a small nominal fee. This information is critical to be able to assess the order flow in the market.
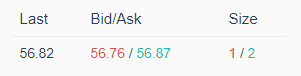
Level 1 Window
On first glance, it looks simple and to the point. Let’s go a little deeper and dissect each component of the Level 1 Window.
Level 1 quotes the real-time bid/ask quotes for securities trading on the Nasdaq and Over The Counter (OTC) Bulletin Board Service. The Nasdaq level 1 quote window is broken out into five key components: (1) Bid Price, (2) Bid Size, (3) Ask Price, (4) Ask Size, and (5) the Last Price.
Level 1 Components
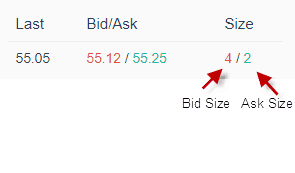
Level 1 Elements
Bid Price
This is the price at which a buyer is willing to execute an order.
Bid Size
The size of the pending buy order.
Ask Price
This is the price at which a seller is willing to execute an order.
Last Price
This is the most recent price at which an order was executed.
Last Size
This is the last size at which an order was executed.
Combining Level 1 and Time & Sales
Time and sales go with Level 1 like a white wine paired with sea bass. To this point, whenever I am saying trading with Level 1, it is implied you have time and sales on the chart.
Why do you need time and sales? In addition to the bid and ask, you also want to see the order flow for trades executed. This allows you to see the movement of the tape. This essentially means you can observe how easily price cuts through critical levels which can be an indication of strength in the market.
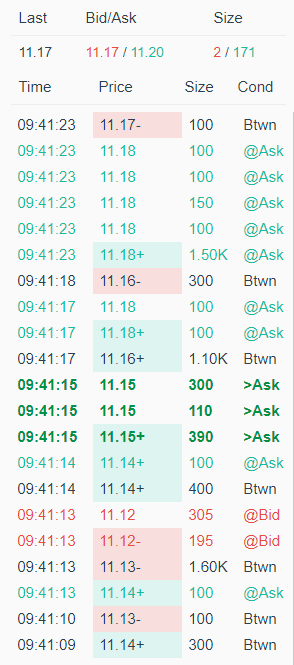
time and sales data
Can You Day Trade with Only Level 1?
Yes.
Talk about a straightforward answer. To further qualify this point, you need to analyze the type of stock you are trading.
Low Volatility, High Float, and High Volume
Low volatility stocks that trade thousands of shares every one minute and do not have wild price movements only require Level 1. For example, a trader can place a 1,000 share sell order for example in Tesla, and the bid will not budge. Also, after your trade is executed, you will not see a 10% move in either direction during regular trading session hours.
This level of certainty of price movement with these high float stocks does not require dissecting market depth which is present in Level 2.
High Float
Can You Day Trade Penny Stocks with Level 1?
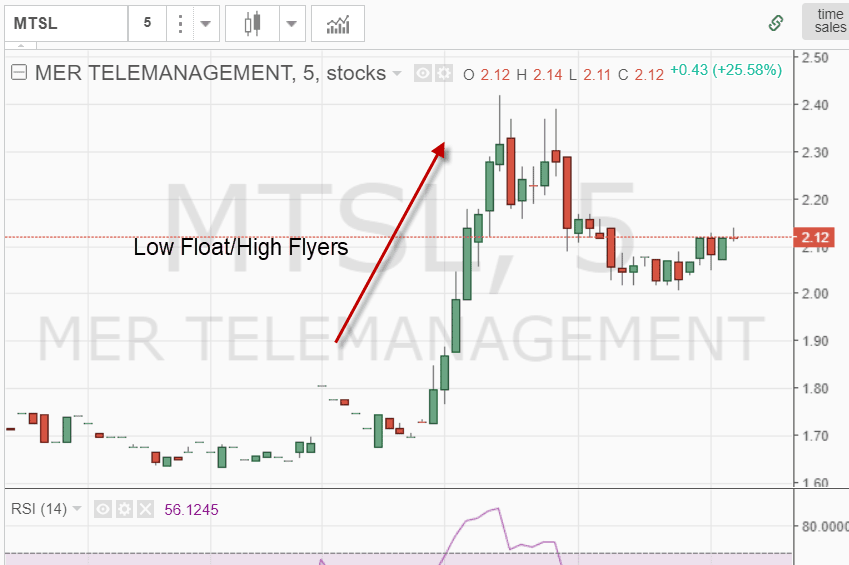
Low Float Stocks
Well yes and no.
I do not trade low float stocks. I recently abandoned this practice after getting my you know what handed to me over and over again.
For me, this decision had little to do with Level 1 and more to do with erratic price swings that penny stocks display.
Enough about me, if you are thinking about trading these penny stocks, you could get by with just Level 1. This will, however, require you to be somewhat ok flying in the dark.
This is where there are two schools of thought in regards to Level 1.
Traders that Swear Level 2 is Required
There are momentum (momo) traders that swear without Level 2 you are dead in the water. These traders require Level 2 to identify when a stock is likely to run out of steam so that they can exit their trades.
Due to the volatility of the stock some traders will make their buy and sell decisions based on Level 2 as other indicators lag too much.
Level 1 is Enough
There is another group of traders that feel Level 2 is no longer of value. In the late 90s, the majority of orders were real, and there was not the level of sophistication with masking of orders and sending fake buy/sells to alter the bid/ask prices.
But now, with the advent of AI and millions of orders routed to the exchange just to see if there are potential buyers on the other side – is any of it real?
These skeptics feel that Level 2 is now just noise and a means to shake you out of a winning trade.
Who is Right?
The truth is likely somewhere in the middle. The most important thing is just to pick either Level 1 or 2 and master it by practice trading with these off-chart indicators.
As an Investor Should You Care About Level 1?
No.
As an investor or swing trader, you just need to focus on the charts.
My time would have been better spent looking at support and resistance levels on my charts.
It’s truly an example of missing the forest for the trees.
How to Use Level 1 as a Stock Screener
Another use for Level 1 is to filter out trades. So how do you do this exactly?
Well, you first need a system to identify the stocks you want to trade. I do not want to suggest Level 1 will somehow find you winning setups.
But what Level 1 can do for you is quickly identify stocks with large spreads. Why are large spreads important to a day trader?
Day trading is a game of inches, and each tick can make or break your profit margins.
This ability to keep your margins in the positive is much easier with a stock with tight spreads versus a stock with a one percent spread.
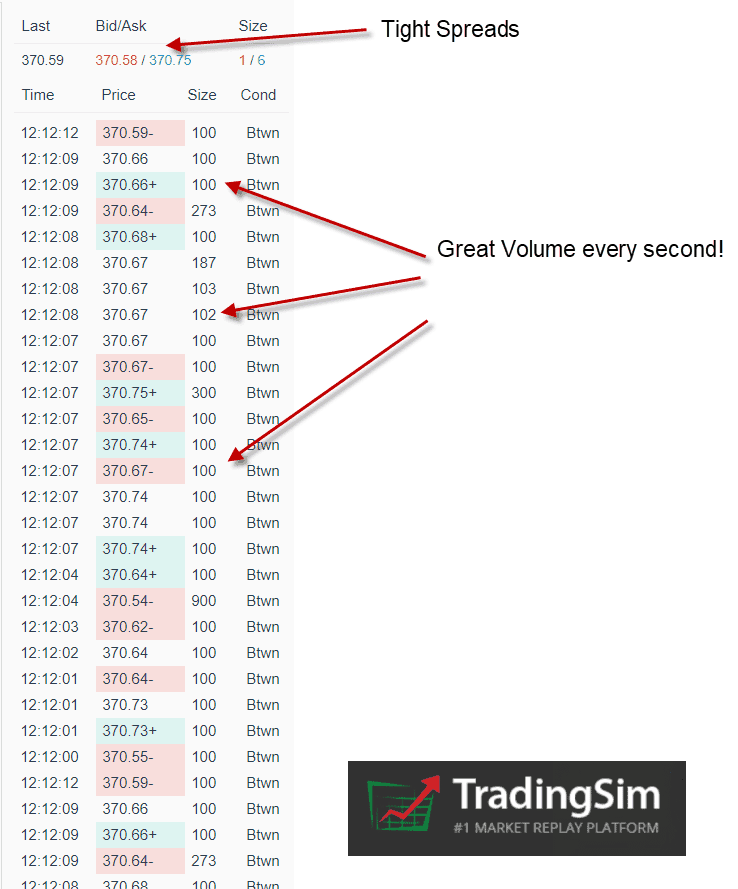
Let me illustrate this through real Level 1 data.
Google
As you can see the spread between the bid and ask is a tight .16%.
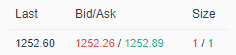
Google Spread
Bluelinx
Shifting gears to a high volatility stock, look at this bid/ask spread of .8%.
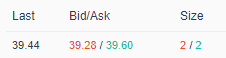
Bluelinx
I avoid these stocks with large spreads no matter how great the setup. When the spread is going in your favor, it is an amazing experience. It’s like the stock can move a percent or more in a matter of seconds.
However, when you are on the wrong side of a large spread – the pain is all-consuming.
What’s the Difference Between Level 1 and Level 2?
The difference between Level 1 and Level 2 comes down to market depth. When you are using Level 1, you can only see the best bid and ask.
However, you do not see the orders from all the exchanges. Why do you need to see these orders? If you are trying volatile stocks, you need to see how many orders are holding a stock up versus those looking to push the security down.
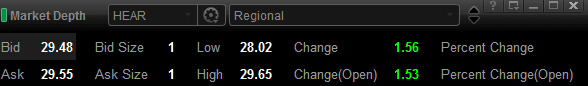
Level 1 Quote Box
If you are just looking at Level 1 above, you would only see the orders at 29.48 and 29.55.
For each price, there is an offer of 100 shares. Not much to go on.
Now, let’s go over and look at the Level 2 screen.
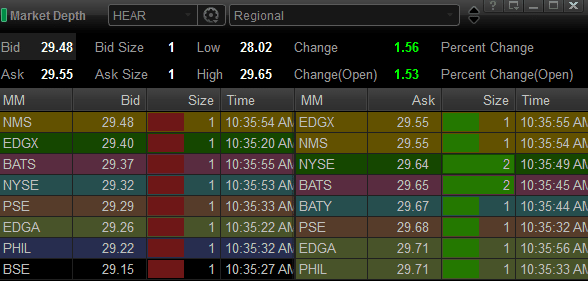
As you can see there isn’t anything alarming from this level 2 screen. The one area of resistance is in the 29.64 and 29.65 range. One observation you can make from the Level 2 data is that there is an equal number of buyers and sellers.
You were likely expecting to see some crazy level 2 screen. Surprising right.
The awesome thing about this example is you can see orders as low as $29.15 and as high as $29.71.
You will need to go through this exercise over and over again to identify which side is likely to win the constant battle.
In Summary
Whether you trade futures or stocks, you will use Level 1 as a key off-chart indicator when navigating the markets. Unlike other indicators that have clear overbought and oversold readings, you will need to build the muscle memory for how to trade with Level 1 because it is a subjective indicator and is different for every security.
I hope you found this article helpful. If you are interested in paper trading with Level 1 and time and sales, please take a look at our homepage to see how we can help.
Good luck trading.


 Day Trading Indicators


