Accordingly, the indicator has the ability to identify what could happen if the regression line continued.
Least Squares Moving Average Calculation
The indicator is based on sum of least squares method to find a straight line that best fits data for the selected period. The end point of the line is plotted and the process is repeated on each succeeding period.
The formula for calculating the line of best fit is
b = ( nΣxy – ΣxΣy ) / ( nΣx² – (Σx)² )
a = ( Σy – bΣx ) / n
Where n is the number of data points selected; y is the price; x is the date; a is the constant (the value when x equals zero); b is the slope of the line
Uses of Least Squares Moving Average
The least squares moving average is used mainly as a crossover signal to identify bullish or bearish trends.
In the below chart, we have selected the one-minute chart of iPath from July 12th, 2016 and have applied the least squares moving average indicator (blue line).
We have applied the default settings of 25 periods – LSMA (25, 0).
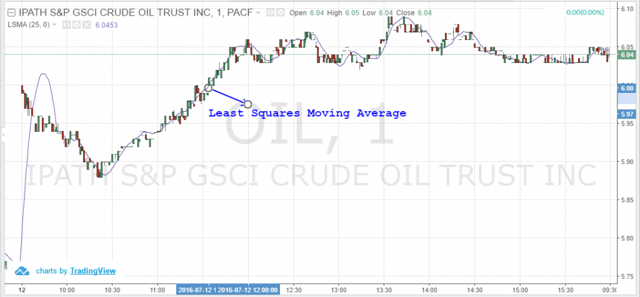
Least Squares Moving Average
The least squares moving average generates signals, when the price deviates from the indicator.
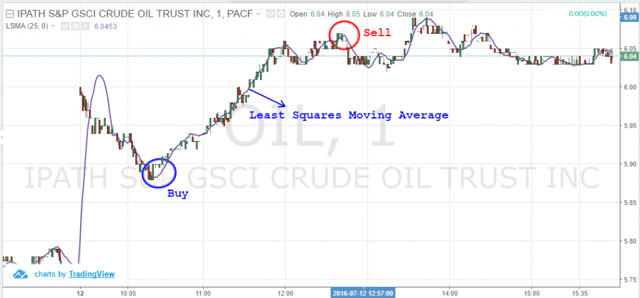
Now, like any other moving average, we need to assess when the least squares moving average is indicating a change in trend.
If the signal changes to an uptrend along with recovery in prices, a buy signal is generated. If the signal changes to a downtrend along with a fall in price, a sell signal is generated.
For instance, you can see these buy/sell signals from the same one-minute chart for iPath highlighted in the blue and red circles respectively.
Least Squares Moving Average – 2
Let’s combine the least squares moving average with the most commonly used simple moving average and exponential moving averages on the same iPath chart.
However, this time we selected a three-minute chart to assess the differences between these moving averages.
To further align the moving averages, I have adjusted the least squares moving average to 9. The exponential moving average is highlighted in orange while the simple moving average is highlighted in pink.
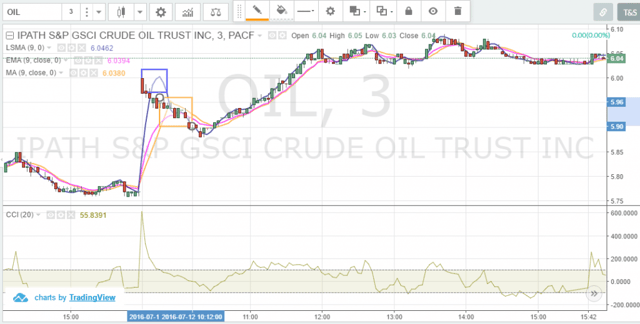
LSMA – Exponential and Simple Moving Averages
As you can see in the above chart, the simple moving average and exponential moving average are closer to the price as compared to the least squares moving average.
On the other hand, the least squares moving average is signaling the trends slightly ahead of both indicators. You can see this in the above chart where the least squares moving average is showing the uptrend signal (first rectangle highlighted in blue), before the simple moving average and exponential moving average (second rectangle also highlighted in orange).
The least squares moving average is also used with different time periods. Similar to other moving averages, the crossover of a faster moving average indicator with a slower one can indicate a buy or sell signal.
Below, is the three-minute chart for the QQQs, where we have chosen the two LSMA lines – 9 and 18. The LSMA (9, 0) is highlighted in blue while the LSMA (18, 0) is shown in orange. You can see that we have shown the sell or buy signals near the crossovers based on the trends.
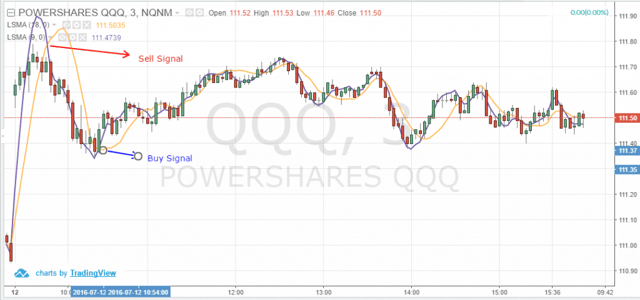
LSMA – Exponential and Simple Moving Averages 2
Why the Least Square Moving Average is complicated for Retail Traders
Now, you must be thinking that the indicator is better than the most commonly used indicators like the SMA and EMA based on the above write-up.
Relax! LSMA has its own weaknessed, and gives false signals like any other indicators. In fact, the indicator could give more false signals than its counterparts, especially when trying to identify a shift in trend.
You can see this in the below three minute QQQ chart for July 8th and 11th, 2016. We have highlighted two false signals in red. Here, you see that the least squares moving average indicator is showing a sell trend while the prices were in an uptrend.
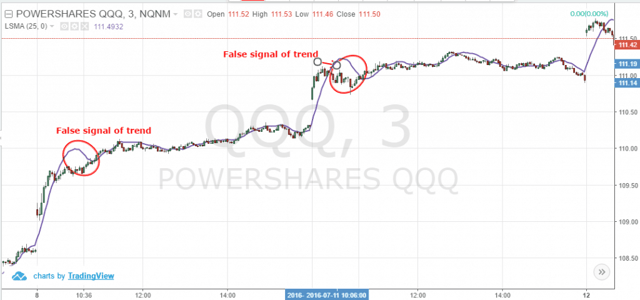
Least Square Moving Average False Signals
Also, be cautious of the least squares moving average signals in case prices widely deviate from the indicator.
We can see this wide deviation in the July 12th three-minute chart of the QQQ. The least squares moving average is indicating a downtrend while prices were rising.
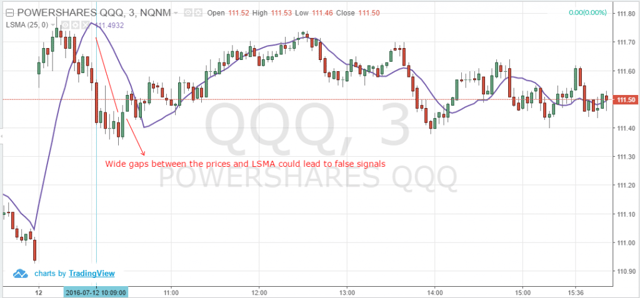
Wide Gaps and Least Squares Moving Average
More confusion when combining the indicator with other momentum indicators
Let’s try to see if we can avoid the false signals from the least square moving average by combining it with other indicators.
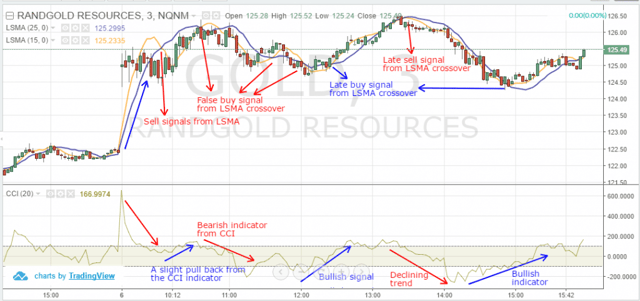
We have the three-minute chart of ADR from July 6th and July 7th, 2016. We have applied two least squares moving averages. We have selected the LSMA (15, 0) and LSMA (25, 0).
The LSMA (25, 0) is highlighted in blue while the LSMA (15, 0) is highlighted in blue.
We have applied the commodity channel index (CCI) as the second indicator.
During the initial half an hour of trading on July 6th, you can see the contradictory signals given by the CCI indicator and two LSMA indicators.
The CCI is showing a downtrend, while both the LSMA (15, 0) and LSMA (25, 0) are trending up. However, you can see that the stock was range bound during this period.
At around 10:03 am, you can see the crossover, where LSMA (15, 0) crossed below the LSMA (25, 0) generating a sell signal. On the other hand, you see that there is a slight recovery towards an uptrend from the commodity channel index (CCI).
The stock was trading near $124 at this point of time and crossed $126 later on.
After this, you see a false buy signal from the moving averages cross over. LSMA (15, 0) crossed below the LSMA (25, 0) generating a buy signal.
By then, the short-term uptrend momentum ended and the CCI again indicated a downtrend supported by declining prices. Within a span of 15 minutes, we noticed the LSMA (15, 0) crossing below the LSMA (25, 0) generating a sell signal and prices negan to fall.
So, here you can see the LSMA is giving a slightly delayed signal and not supporting any signal generated from our selected primary indicators.
Momentum day traders could face a tough decision, because by the time the indicator generates a signal, the trend in the stock has already ended or coming to an end.
LSMA and CCI
We could see the least square moving average indicator behavior for the rest of the day as well, which eventually generated false signals or provided trade signals when the trend has ended.
Next there is a slight range bound session in the stock from 12:00 p.m. for about half an hour, where you could see certain false or lagging signals from the least squares moving average indicators.
The CCI failed to generate a definite signal during this period, as we all know that all indicators have their own shortcomings.
However, the CCI again started rising after 12:10 p.m. supported by the slight recovery in prices. But we did not receive a buy signal from the least squares moving average crossover until 20 minutes later.
However, at around 1:30 p.m. we got a sell crossover from the least squares moving average indicators supported by the CCI. Accordingly, we could go short at over $126.20 and cover the position at over $124.50.
But the real challenge here is to identify whether the least squares moving average indicator is giving a false signal or not.
You must be thinking that the LSMA would be beneficial if we combine the indicator with the very popular RSI and MACD indicators.
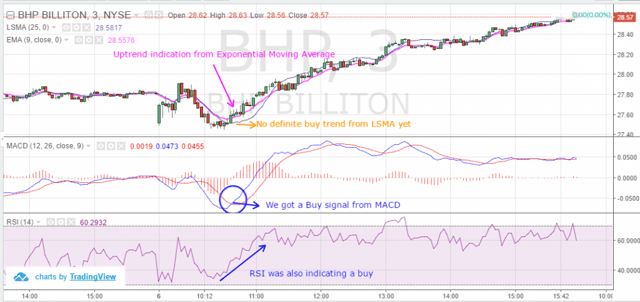
We have a three-minute chart of BHP from July 6th, 2016. We are using the MACD (12, 26, close, 9) and RSI (14) (default indicators).
As you can see in the below chart, we received a definite buy signal from the MACD with a strong crossover signal. By then, we received a signal from the RSI, which was also confirming the buy trend (as highlighted in blue near the indicator). BHP eventually rose post the crossover from the MACD and closed on a positive note during the day.
However, we don’t see any definite signal from our least squares moving average indicator which showed a flat trend during that time period. We have highlighted the flat trend from LSMA in orange as you can see in the below chart.
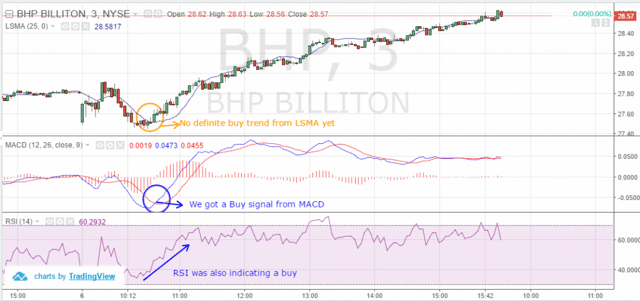
LSMA – RSI – MACD
Now, let’s compare the least square moving average indicator with its counterpart, exponential moving average and see if they are still giving better signals then the LSMA.
For the same three-minute chart of BHP Billiton Limited (BHP) from July 6th, 2016, we have added the exponential moving average and highlighted the indicator in pink.
You can note the difference clearly between the exponential moving average and least squares moving average indicator. The EMA has shown an uptrend on par with the support indicators, MACD and RSI, as well as ahead of its counterpart, LSMA.
LSMA – RSI – MACD 2
Conclusion
The least square moving averages is also known as the end point moving average indicator and is calculated based on the least squares regression line for the preceding time periods.
Like any other moving average, the least square moving average also generates a bullish or bearish trends based on crossovers of itself with two different periods. However, we believe that retail traders should be careful with the least squares moving average signals if the price deviation from the indicator is quite high.
The least square moving average gives a lot of misleading signals to traders and hence we think trader’s need to be cautious while using this indicator. Even if the indicator is combined with the any other trading indicator, we could not confirm a definite trend from the LSMA.
We recommend day traders avoid using the indicator.


 Day Trading Basics


