Initial Public Offering or IPO for short undoubtedly captures the investor’s attention to a stock. The rush to be one of the early investors in a stock is often reflected by the IPO days experiencing huge surge in trading volumes. Most investors often like the idea of getting in on the “ground floor” of a new investment opportunity.
After all, the stock charts often show how much a stock appreciated over a few years of time since its IPO launch and this often gets investors excited whenever there is a new IPO that is offered. Investors who managed to get in on the ground floor for stocks such as Apple Inc. (AAPL), Google/Alphabet Inc. (GOOG) or Amazon (AMZN) are reaping some big benefits.
Why would an investor want to trade the IPO?
Every investor who purchases some stock during the IPO no doubt dreams that the company will appreciate in value over time.
Despite the excitement and the rush to get one’s hands on a stock, successful IPO trading is not about who gets to buy the stock first and it is a bit more complex than one can imagine.
While the “ground floor” idea might seem interesting, there is no telling which way the stock can go. Some investors do get in on the ground floor alright but that took them down to level 4 basement, so to speak.
Thus, there have been investors who managed to buy an IPO and have since then been reaping the rewards and there have also been investors who bought an IPO and have been struggling to break even.
Take the example of LinkedIn, whose IPO price was set at $45 and prices jumped to $90 on the first trading day. LinkedIn, at the time of this article is trading at $195.96. But that is not to say that it was a steady progress for LinkedIn shares.
During the first six months after the IPO was launched, LinkedIn shares were volatile ranging between highs of 110.00 and lows of 62.00.
Then there are stocks that totally tank. Take the example of Facebook and Twitter IPO’s.
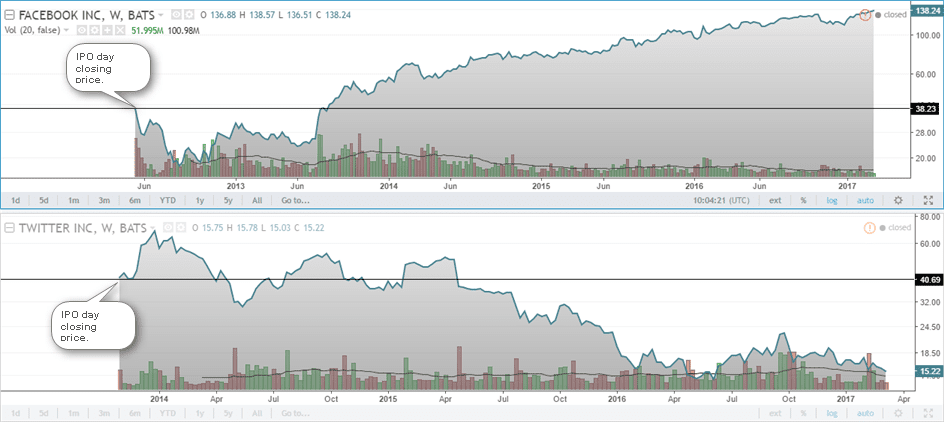
Comparison of Facebook (FB) and Twitter (TWTR) stocks of the opening IPO day closing prices
The above comparison chart shows two completely opposite performance in the prices for Facebook and Twitter. While initially Facebook started to trade below its IPO price of $38.00, shares of Twitter surged off the opening day’s IPO closing price of $40.69 from the IPO price of $26, and rallied to post an all-time high of $69.00
One could have been forgiven back then if they missed the Twitter IPO boat. However, once the ship sailed, the stock prices had a different story to tell.
After Facebook shares fell to all time lows near $18.06, the stock started a steady ascent and after breaking past the IPO closing price, there was no looking back.
On the other hand, shares of Twitter continued to hover near the opening IPO day closing price of $40.69 and one and half year later, prices started a steady descent.
So is there a pattern to trading the tech IPO’s in particular and does a traditional buy and hold strategy works from the time company goes public?
Data from Renaissance Capital shows some interesting statistics covering the period 2012 – 2016
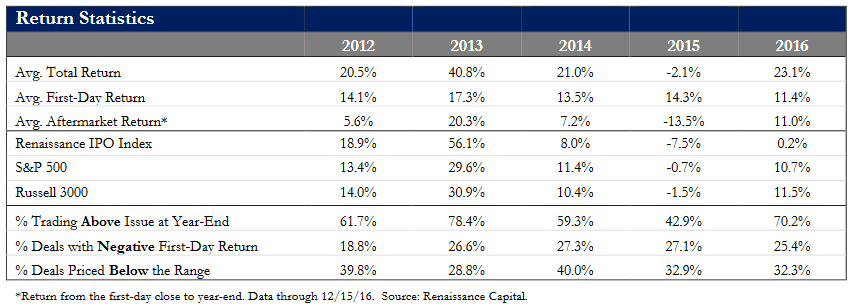
Statistics of IPO Returns (Source – Renaissance Capital)
In 2016 for example, 11.4% was the average first day return from trading the IPO and a whopping over 70% of the stocks that were floated in 2016 were seen trading above the IPO price by the end of the year.
The above table also shows that just over 25% of IPO’s had a negative first day return. The data along with the previous example of Facebook and Twitter shows that there is more to trading the (tech) IPO stocks than merely buying the stocks on the opening day.
Renaissance Capital’s data also shows that Technology companies were leading the way when it came to IPO’s. The tech sector had the highest gains of +40%.
What is an Initial Public Offering?
An initial public offering or IPO for short is a process through which, a private company becomes publicly traded company.
The IPO is the first sale of the company’s stock to the investors or the public and is therefore referred to in investing circles as “going public” meaning that the stocks of a company are going to be publicly traded at an exchange.
In order to be publicly listed, the hitherto privately held companies must meet some strict qualification criteria to be listed on the exchange. Companies make use of an investment bank whose task it is to set the price of the shares and market them to potential investors.
The investment bank represents the seller and the pricing is opaque as it involves the bank and its customers who are typically large scale institutional investors. The investment bank, for its work receives a certain percentage of the proceeds from the IPO.
When an IPO is launched, the first sale of stock via the investment bank (also referred to as the underwriters) is referred to as the primary market.
Unfortunately, the average investor doesn’t have access to the primary market as it is mostly large hedge funds and other institutional buyers who get in on the ride. Some companies also use this opportunity to give some initial shares to their employees as well.
Once the underwriters meet the primary market target, the stocks are floated on an exchange, which is the secondary market. This is where the average retail investor is able to buy the shares.
The price at which the shares are bought can be higher or lower than the IPO price. This typically shows what the general market expectation is and tends to answer the question of whether the IPO price was underpriced or overpriced.
On the first day of trading, the stock price is very volatile due to the above mentioned reason and thus investors need to be very careful in how they trade and should accept the wild swings that one can see.
For example, in the tech IPO scene, in 2016 the first day pop as it is often referred to, can be very volatile. Shares of Acacia Communications (ACIA) jumped 34.6% as prices jumped from the IPO price of $23 to close at $30.95.
If you thought this was volatile, then the first day pop from Nutanix (NTNX) goes a step further, posting a 131% jump approximately on the first day of trading. The IPO price was fixed at $16.00, and on the first day, shares jumped to close at $37 and sky rocketed to $44.46 the next day.
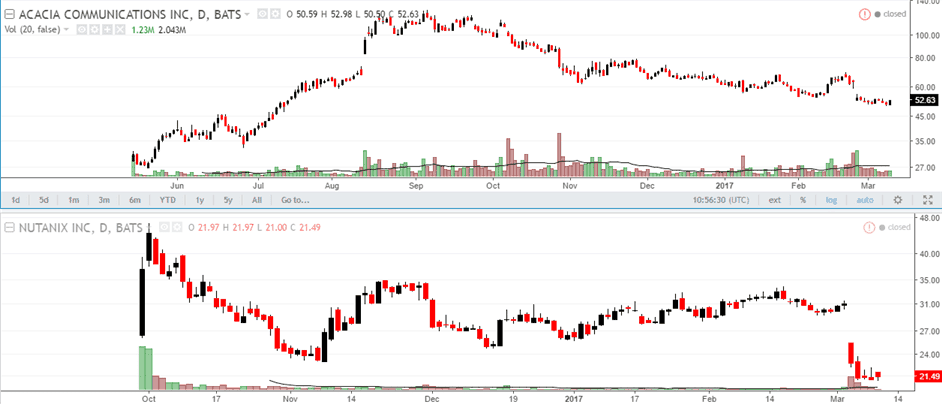
Tech IPO First Day pop (Examples of ACIA & NTNX)
Examples of trading Tech IPO’s
Not all tech IPOs behave the same way. This means that while some stocks might see a 10% – 20% pop on the first day there are also stocks that tank on the first day of trading, falling below the IPO price as well.
As mentioned, for the trader, the tools are limited as far as technical analysis goes, which leaves a lot to the market forces. Thus, tempting while it may seem, trading tech IPO’s or any IPO for that matter, without proper knowledge and information about the company can be disastrous.
The amount of fluctuation a stock goes through on the first day reflects the market sentiment on the initial pricing that was set by the underwriters. Here are three examples of trading the tech IPOs.
Trading Facebook (FB) IPO
When Facebook (FB) hit the markets it was at an IPO price of $38 per share. When the stock started trading, it opened at $42.49. Now if you thought of buying FB’s stock at the opening price you would have been facing some losses as the stock broke down below the $38 handle and in fact closed just at $38.22.
This first day of trading showed that FB’s IPO price was more or less in line with the market expectations. Buyers, tried to push the stock higher, but failed bringing prices back to the IPO price.
With lack of any technical indicators, it all comes down to trading based on volume and good old support and resistance or supply and demand.
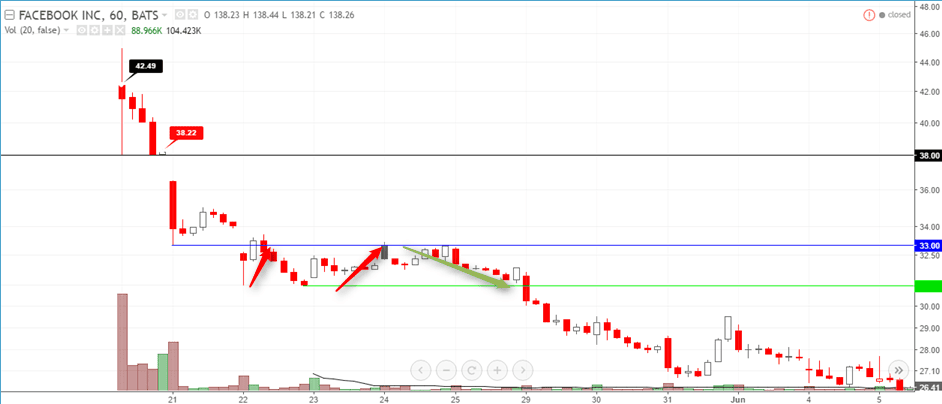
Day trading FB Stocks on IPO
In the above chart you can see that after the initial dip on the second day, Facebook shares tried to push higher but soon broke down below the second day’s initial low of $33.00. The second attempt to test this price level from below was an opportunity to sell the stock near $33.00 and to exit near the previous all time low posted at $30.95.
For investors who were looking to buy Facebook at a discount could have waited for the stock to hit the lows. Soon after price fell to an all-time low at $17.55, Facebook’s stock rallied but remained range bound.
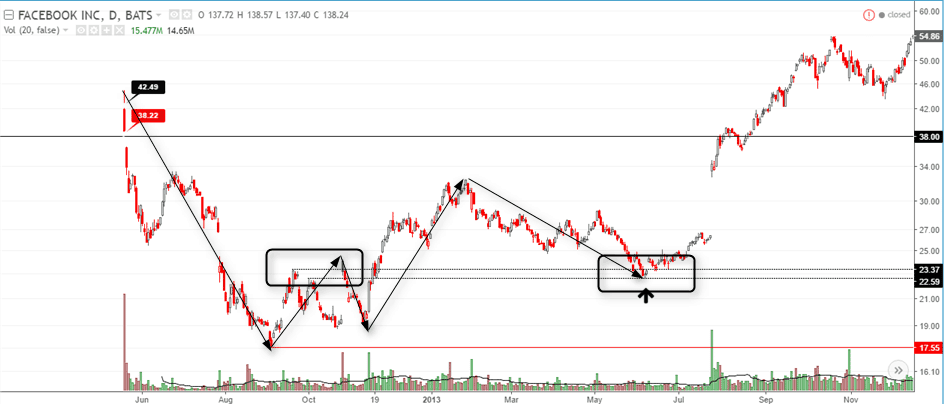
Facebook IPO – Patient investors would have been rewarded here
The next chart above shows the price action on the Facebook stocks. Agreed, it took nearly a year, but investors who were vigilant would have bought the stock near $22 – $23, setting themselves up for some big rewards.
Trading Twitter (TWTR) IPO
In the case of Twitter, shares opened a lot higher than the $26 IPO price and touched intraday highs of close to $50 before falling back close to the opening price. Here too, a similar pattern can be seen with the difference that the stock’s first hour low was the main threshold.
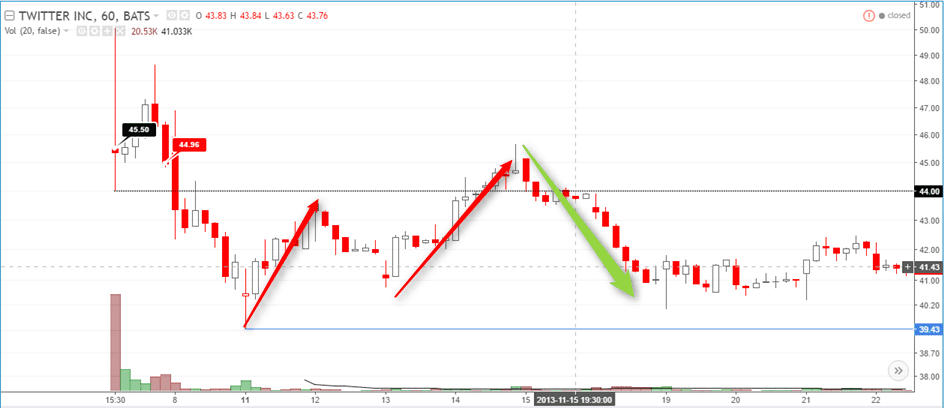
Day trading Twitter on IPO day
After price failed to hold the first hour low, Twitter shares fell below $44.00. The brief rally back to $44.00 few days later would have offered a good opportunity to sell the stock, targeting the previous all time low at $39.43.
From a longer term point of view, in the case of Twitter, it is not hard to miss the fact that after the initial rally above $72.00, Twitter shares started to post lower lows. The initial break and rest of $55.59 was a signal that could have alerted investors of the potential downside in price.
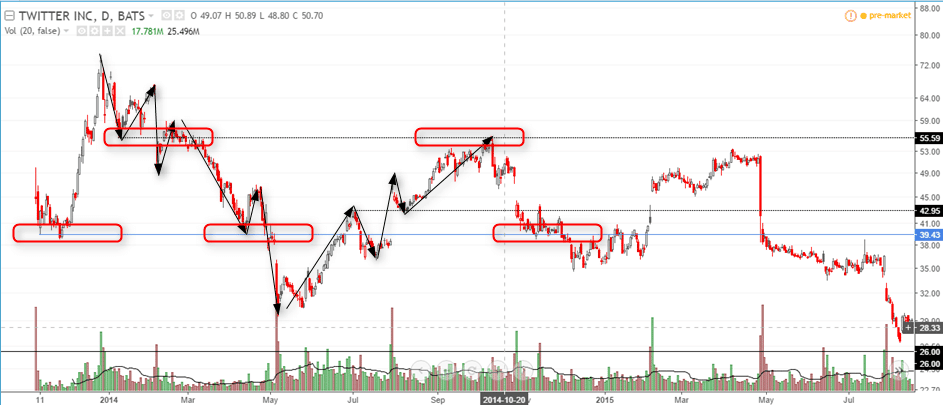
Twitter IPO trading – Prices remained trading sideways for nearly two years
In fact for the most of 2014 and 2015, Twitter’s share price continued to range sideways which could have offered the swing trader very good opportunities to technically trade this stock.
Besides the technical factors, a few months after the IPO excitement faded, investors started to figure out fairly quickly about the apparent weakness in Twitter’s ability to monetize the platform, along with management factors that weighed on the stock.
The recent decline in Twitter’s shares is thus not surprising considering that company continues to struggle to find ways to monetize the platform despite the high level of usage of the product.
Trading Snapchat (SNAP) IPO
For Snapchat, the response has been mixed and the outcome depends on how one can view the IPO day. Snapchat was priced at $17.00 and the stock opened at $24 and posted an all time high to $29.44. Leaving the noise aside, we can see a similar pattern where in price broke below the first hour’s low of $23.50 and fell to post a new all time low at $20.64.
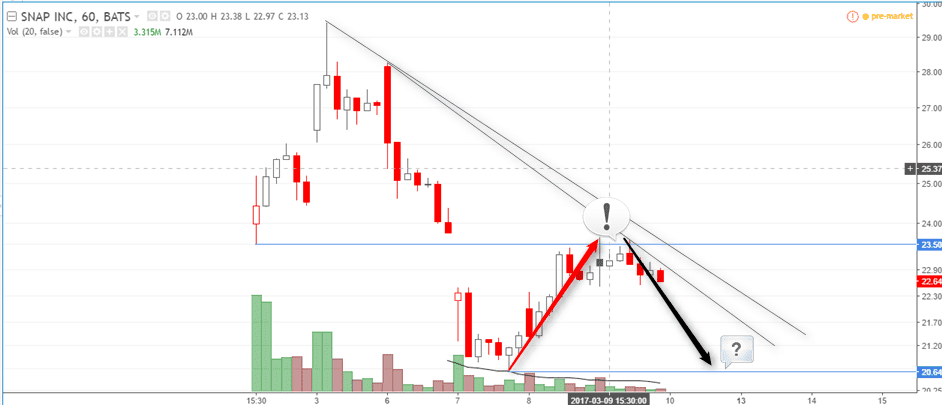
Snapchat (SNAP) IPO day trading
Then price managed to rally back but here, we can see that $29.44 acted as resistance. Thus, this indicates a potential fall back towards $20.64. Bear in mind that the initial IPO price of $17.00 is still far away from the current price but it wouldn’t be surprising to see shares of Snapchat fall to the level of $17.00 a share.
From a fundamental perspective, Snapchat’s valuation of $34 billion puts it ahead of big companies such as American Airlines, Viacom among others. While this can be considered a victory in itself, investors are reminded about the high valuations and the eventual goof up with Twitter stocks.
Snap, the company behind Snapchat generates its revenues from advertising. It is estimated that in 2016, the company’s revenues grew sevenfold. Analysts argue that if the company can keep adding its customer base at a steady rate, the current valuations would be more than justified.
The rhetoric sounds increasingly similar to that of Twitter. While it is still early days to say which way the wind blows, traders should be well prepared when it comes to tech IPO’s. After all, the first day pop is by no means a gauge to show which way prices will move. On the same note, if overall industry statistics are to be believed, there is scope that Snap’s stock price will probably appreciate in the years to come.


 Day Trading Basics


