Investors who lost money on Black Monday in October 1987 would have never imagined the strong Bull Run that engulfed the equity markets in the following years. With the Dow Jones index now standing within a few points grasp of conquering new highs, here’s a brief look at the how the DJIA has performed, since hitting lows of 1766.7 on Black Monday, and the factors that led to the crash and the policy decisions that helped the Dow to continually brush aside the dips and move into one of the strong bull runs ever seen in U.S. history. Despite hitting a road bump later in 2007-2008, the Dow managed to recover and rally to post record highs of a few points short of reaching a new milestone of 20,000.
The year 1987 brings about memories of the Black Monday on October 19th, 1987 where equity markets across the world crashed in tandem spanning from Hong Kong to Europe and then to the United States. On the day, the Dow Jones industrials average fell by over 22% losing 508 points, extending the declines since early September. As a result, over $500 billion in valuation was lost.
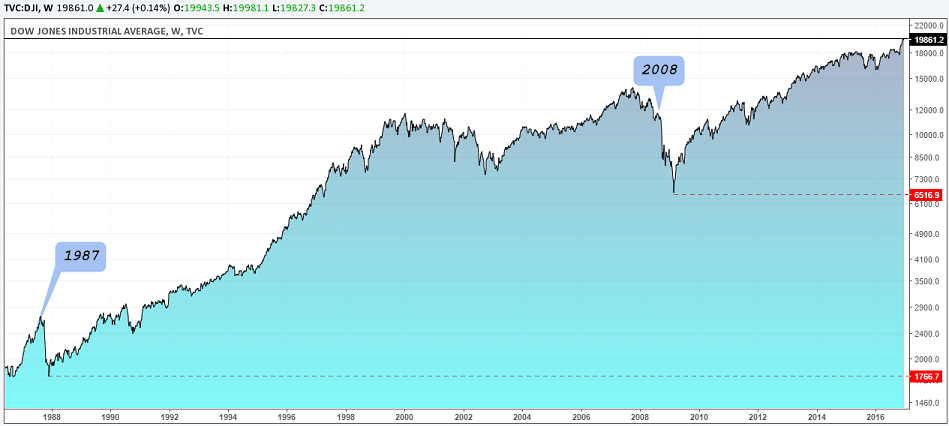
Dow Jones industrial average 1987 – 2016
The market crash came amid a powerful bull rally in equities, fuelled corporate M&A activity. Companies were seen scrambling to raise capital to buyout, and mergers were at the peak. The prevailing wisdom at the time was that mergers and acquisitions was the way for companies to power ahead which expected to see exponential growth in the years ahead. However, the Black Monday marked the end of the “five year bull run” it was said at the time as the Dow rose from a modest 776 points in August of 1983 to an impressive 2722 by August of 1987 just before the crash.
The most notable event was what happened after the crash as the Dow posted a strong rally marking one of the largest one-day gains on record for its time, rising nearly 102.27 points on the very next day and over the course of the next two years, the markets managed to completely recover from the 1987 crash, something that was unimaginable at that point in time. By early 1992, the Dow was comfortably posting higher lows above the 1987 highs.
Contributing to the remarkable turnaround in the Dow after the crash was a number of factors, but the actions by the Federal Reserve stands out. Since the 1987 crash, the Dow Jones Industrials Average has managed to weather many more crises including the Great Recession in 2008.
The 1987 Stock market crash and recovery
While many talk about the September crash in the Dow Jones, in hindsight the index was looking weaker since late August. A series of events, both from macroeconomic perspective as well as geo-political developments eventually saw the dark clouds culminate into a perfect storm.
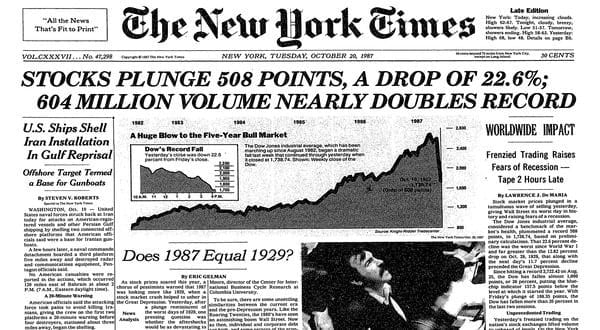
1987 Black Monday Stock Market Crash Source – NY Times
After posting record highs to 2722 in August of 1987, the Dow Jones index started to show signs of weakness thereafter. On September 22nd, 1987 the Dow Jones fell 8.4% but the declines managed to stabilize. In early October of that year, the Dow managed to pull back, recovering by nearly 6%. Thereafter a few attempts to rally soon fizzled as the index finally gave up and crashed. While the index lost over 22% on the day of October 19th, when looked at from the peak to the trough, the Dow Jones Industrials lost over 36.7%.
The crash of 1987 has since then become a subject of study among economists and analysts alike as it came as a surprise to many. Among the many theories that were floated, some of the most debated ones included the market illiquidity of the time. It is said that the inability to manage the high volume of sell orders of the time became too difficult to manage as investors preferred to sell the stocks at almost the same time.
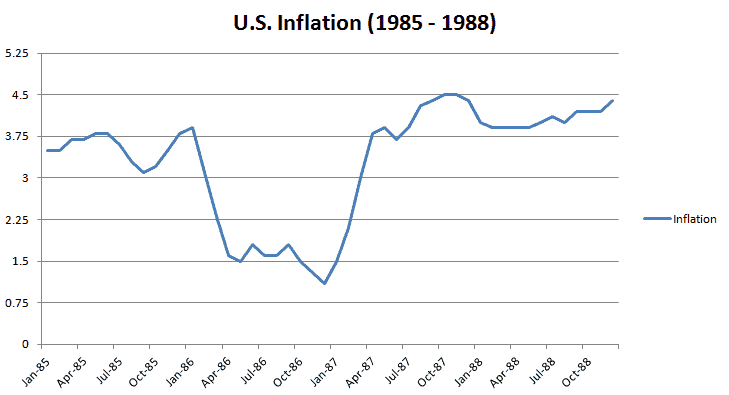
U.S. Inflation (1985 – 1988) Source – USInflationcalculator.com
On the economic front, the U.S. economy was showing signs of overheating as inflation continued to rise and became a concern. This evidently led the Federal Reserve to rapidly start hiking the short-term interest rates which also dampened investor expectations. Inflation rapidly increased since the start of 1987 after hitting a low of 1.5% and was seen rising back to the pre-87 levels of above 3.75%.
As the uncertainty continued to rise, institutional managers began hedging their equity exposure by taking short positions in the futures markets. As the chicken came home to roost, the market was suddenly flooded by billions of dollars of positions on the short side and in the day leading up to the October 19th market crash, the sell orders continued to pile on within a matter of minutes. This eventually triggered a massive crash in the futures and cash markets.
On the geo-political front there was crisis growing in the Middle-east as well. In the week surrounding the October 19 crash, Iran fired missiles at the American-owned supertanker which was sailing under the Liberian flag just off Kuwait’s Mina Al Ahmadi oil port. This was on October 15th. A day later, another U.S. owned ship MV Sea Isle City was also hit by another missile fired by Iran. On the D-day, the crises quickly engulfed the markets which soon spread across the world. Even the London FTSE100 fell by over 136 points as news emerged that the U.S. warships shelled an Iranian owned oil platform in the Persian Gulf. By the time the U.S. markets opened, the risk off environment was widespread.
How did the Dow Jones recover after Black Monday?
Following the market crash, the U.S. Federal Reserve was quick to respond to the crisis starting with quickly lowering interest rates. It took nearly 15 months for the markets to recover and in hindsight the recovery after Black Monday was a lot quicker compared to the 1929 market crash which took nearly a quarter of a century for investors to regain confidence.
The markets shook off the dust led by various factors that eventually helped to boost investor confidence. Besides the efforts from the Federal Reserve, listed companies also embarked on buyback plans in an effort to restore confidence in the markets which helped to entice bargain hunters to jump in.
The Federal Reserve on its part also sent a strong message to investors noting that there was further room for rate cuts and that the Fed was ready to pump money into the economy. Two major banks also lowered their prime rates which helped to bring assurance to the markets at large.
Alan Greenspan, the Fed Chair at the time said, “The Federal Reserve, consistent with its responsibilities as the nation’s central bank, affirmed today its readiness to serve as a source of liquidity to support the economic and financial system.”
Rumors of recession were quickly put to rest as President Reagan reassured the people that the economy was in good hands highlighting that at that point in time the U.S. unemployment rate was at an eight year low alongside healthy corporate profits. For doomsayers, there were still concerns especially about consumer and corporate debt.
By October 23, the Dow Jones was showing signs of life as the index managed to slowly edge higher led be concerted efforts by the U.S. Government, the Federal Reserve and the corporate sector’s buyback programs, all of which managed to instill confidence in the investing community.
A day later, the Fed followed up on the statement with substantial open market purchases over the coming days and weeks. Although many skeptics argue that it was the Fed which managed to help investors, in reality the Fed did nothing. The few open market operations that the Fed did conduct was nothing out of the ordinary and in comparison the Fed’s injection of liquidity was more pronounced during the Y2K crisis and post 9/11.
The Great Recession (2007 – 2008 crisis)
After investors managed to survive a few minor dips in the rally, nothing prepared them for what was in store ahead of the 2008 financial crisis. The world economy faced one of its most dangerous crisis which was only perhaps comparable to the Great Depression of the 1930’s. The crisis of 2008 started a year earlier as home prices sky rocketed before the bubble burst. The risk spread to the financial sector in the U.S. and eventually to the financial markets overseas. The crisis of 2008 was underpinned by the global interconnectedness among markets, spanning from New Zealand to London and the U.S.
The list of causalities started to build up with the investment banking industry at risk, pulling down the biggest insurance company as well as two enterprises chartered by the U.S. government to facilitate mortgage lending. It eventually affected some of the leading commercial banks across the globe as well. The crisis of 2008 was not just limited to the financial sector but to other industries such as the auto sector which required a federal bailout.
During the crisis of 2008, the Dow Jones industrial average lost 33.8% towards the end of year as a deep sense of pessimism engulfed investors globally. By the end of the year, the U.S. National Bureau of Economic Research, considered to the arbiter determined that a recession had begun in the United States in December of 2007. The 2007 – 2008 crisis was marked in history as one of the longest recessions (and a third) in the history of the U.S. since World War II.
Between the 2008 – 2009 periods, the Dow crashed twice. Once in September 2008, the other in January – March of 2009. Unlike the 1980’s crash, this time the markets were looking weaker due to the fundamentals in the global economy. The first crash came after the U.S. Congress rejected the bank bailout bill. The Dow fell 777.68 points during the day. A few months later, the Dow once again crashed, losing over 50%, falling to 6594.44 by March 2009.
The warning signals leading to the 2008 crisis was increasing with early reports showing that new home permits were falling at a fast pace while home prices also started to fall triggering defaults in the subprime markets. The government on its part felt that the slowdown in the housing markets would not affect the rest of the economy. By the time officials realized the impact of the crisis by October 2008, the contagion had spread. This led officials into a crisis management mode, with the Federal Reserve lowering interest rates to near zero, and increasing its open market purchases.
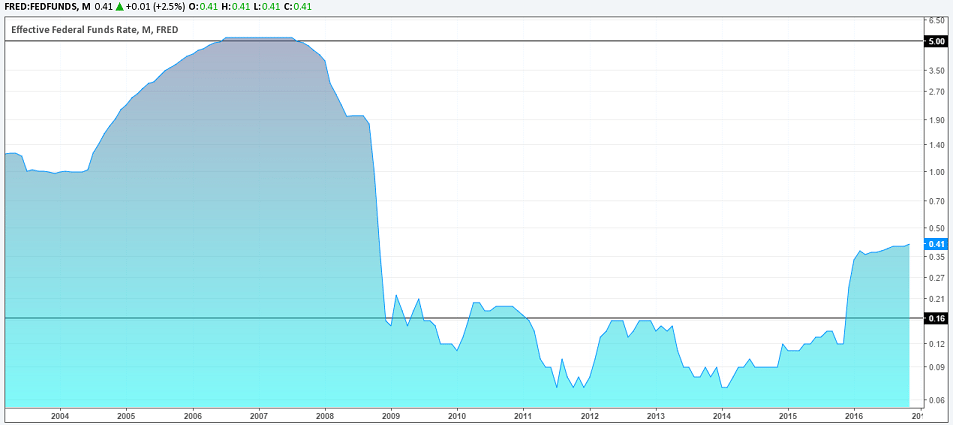
U.S. Fed funds rate (2007 – 2009)
Unlike the crash of 1987 where mere words were enough to restore confidence, the 2008 financial crisis saw the Fed eventually increase its open market operations. The Fed maintained its quantitative easing until it saw the U.S. unemployment rate fall to 6.5%.
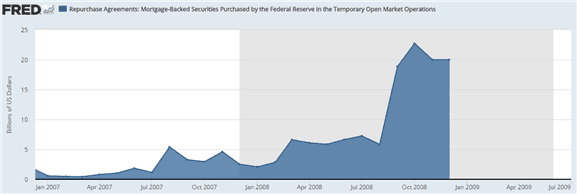
Fed Open Market Operations – Mortgage Backed securities purchases
The Fed’s quantitative easing program, alongside low interest rates managed to push the equity markets gradually higher. After nearly five years since announcing QE, the Fed finally called time on its monthly MBS purchases in late 2014. The U.S. economic recovery was still patchy but the unemployment rate stabilizing falling back below the 6% target that Fed had set.
Since 2014, the U.S. economic recovery grew at a gradual pace with the unemployment continuing to fall steadily. Meanwhile, lower oil prices kept inflation pressured to the downside which helped the economy as well. By 2015, the U.S economy was ready to brace itself for the first rate hike in a decade, as the Federal Reserve hiked interest rates by 25 basis points, bringing the Fed funds rate to 0.25% – 0.50%. Amid the uncertainty in the global markets, the Dow Jones managed to brush off the Brexit risks as well as the U.S. political elections in November 2016 as the index pushed above the 18,000 handle and appeared well prepared to digest another 25 basis points rate hike from the Fed in early December 2016.
The Dow has so far posted a high at 19987.6 on 19th December, just a few points shy of the elusive 20,000 mark which investors have been eagerly waiting for.


