A blow-off top is a technical chart pattern that is identified by a very sharp and rapid increase in a security’s price including volume which is followed by an equally sharp and rapid pace of decline in price and volume. The sudden spike and then a decline is referred to as a blow-off top or an exhaustion move in prices and commonly found in the stock markets. When positioned correctly, day traders can make huge profits by concentrating on fading the blow-off top pattern alone.
When you fade a blow-off top, the risk/reward factor can be huge at times, but this means that day traders need to understand what a blow-off top looks like first, and then position themselves to short this exhaustion pattern. Because of the fact that a blow-off top occurs at the top end of the rally, it is akin to catching a top. While it is easy to showcase a blow-off top pattern in hindsight, trading this pattern as it unfolds can be a task.
However, with enough perseverance, traders can practice trading the blow-off top pattern on a simulated trading account to gain the confidence. In this article, learn how to day trade by fading the blow-off top pattern.
How is a blow-off top pattern formed?
A blow-off top chart pattern is often fueled by some news or an event that is not discounted in the markets already, causing the sudden knee-jerk reaction in prices. This is more common in stocks where regulatory news about a sector or an industry, or some big headlines affecting the stock price could result in a blow-off top pattern to be triggered.
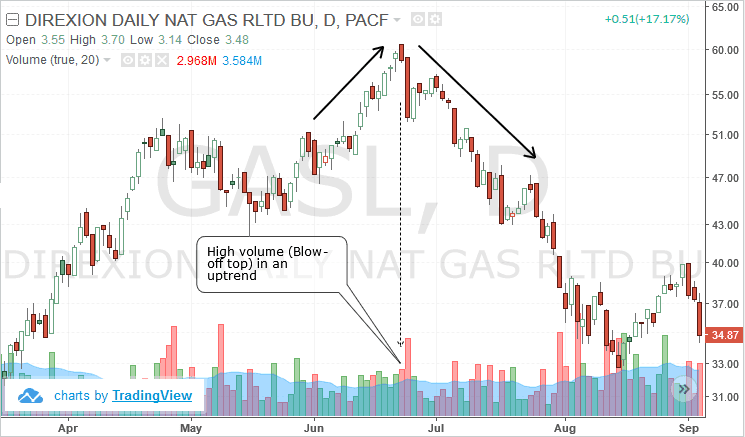
Blow-off top in an uptrend
While a blow-off top forms ahead of a price decline, blow-off bottom happens when prices are trading in a down trend and indicates that a possible bull rally could be in the making.
Technical analysts call the blow-off top pattern as an indication that the security’s price is likely to fall and has prompted many fading strategies to trade the blow-off top. However, day traders should remember that such moves are counter trend as one wouldn’t really know if the price exhaustion was really a change in trend or if it was a mere retracement. Given the uncertainty surrounding the blow-off top pattern, traders should be conservative in their target levels so as to take the profits that the markets offers and exit before the market reclaims those profits.
The blow-off top fading strategy finds its basis on the fact that the security’s price move is irrational or at best an over-reaction to a certain event or news. This draws in some investors who want to take part in the rally jumping in and adding to the bullish sentiment, momentarily pushing the stock’s price higher.
The blow-off top pattern can also be formed within a downtrend in price. However in this case, the blow-off top pattern forms a sharp correction which is indicative of a rally in a down trend.
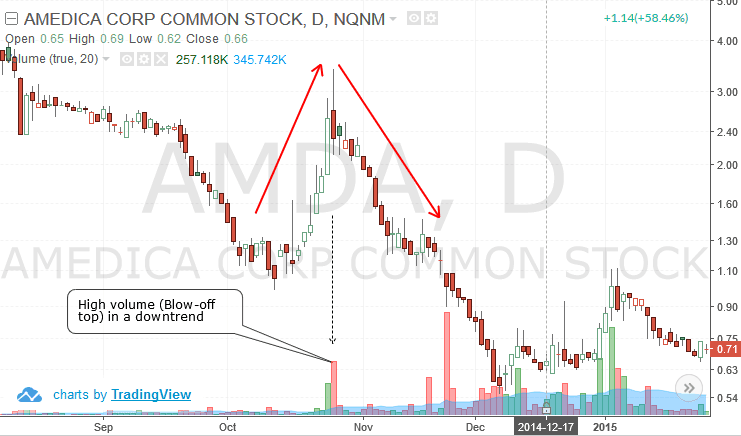
Blow-off top in a downtrend
Anatomy of a blow-off top
A blow-off top usually happens in a stock that is trending higher. The sudden surge in prices causing the top comes when undiscounted news or an event occurs. This, adding to the bullishness see’s a surge in volume as investors jump in to buy the stock. It is usually the retail or small investors who are drawn into the stock’s price at this point in time.
The blow-off top is referred to as a buying climax and develops towards the end of an uptrend and near the top. The blow-off top merely signals a change in the trend. It could be the start of a new trend, or perhaps just a pull back. A blow-off top is characterized by the following characteristics.
- The increase in the volume as well (which in most cases will be above average)
- The increase in the price of the stock is rapid and is usually baffling. In some cases, this surge in price coincides with a new 52-week high in stocks
- The high of the day fails. While price jumps to post a new high on an intraday session, the security’s price often retreats failing to hold the day’s high with eventually the closing prices turning bearish on the day. The top is also seen with a wide range in price.
The third point is the most important in identifying a blow off top pattern, of course validated by the fact that it occurs after a prolonged uptrend and that the spike in price was sharp with a surge in volume as well.
There are many different ways a blow-off top can be determined to be one. But as with most cases in technical trading, nothing is set in stone and traders need to partly apply discretion and trade based on what their experience tells them. A blow-off top pattern is no exception to the rule either.
Among the many different ways one can identify and trade a blow-off pattern, the easiest pattern is to look for a top being formed on high volume on a bearish close with the top failing.
How to short a blow-off top pattern
There are different ways to trade a blow-off top pattern when it comes to stocks. For day traders, a blow-off top could be looked at based on the 1-hour chart time frame. The rules remain the same, which is to focus on stocks that are trending steadily higher and wait for a blow-off top to occur, usually in the morning session where a new intraday high is posted and then price closes lower. This can be validated by a surge in volume as well.
The first example below shows a 60-minute chart for Dolby Laboratories (DLB). This stock chart was picked due to its steady intraday trend with price posting consecutive higher highs and higher lows, making it as a prime candidate for a potential blow-off top pattern.
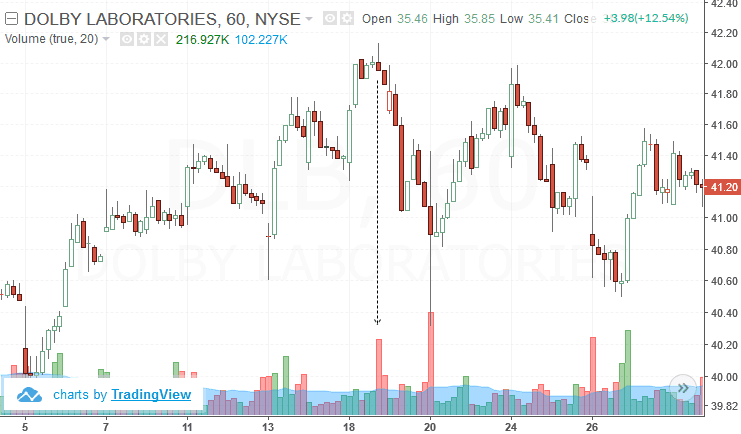
DLB – Intraday blow-off top
You can see how price was then turning flat near the $42.00 level. Then finally you can see a new intraday session high being formed followed by a bearish close, validated by an above average volume spike as well.
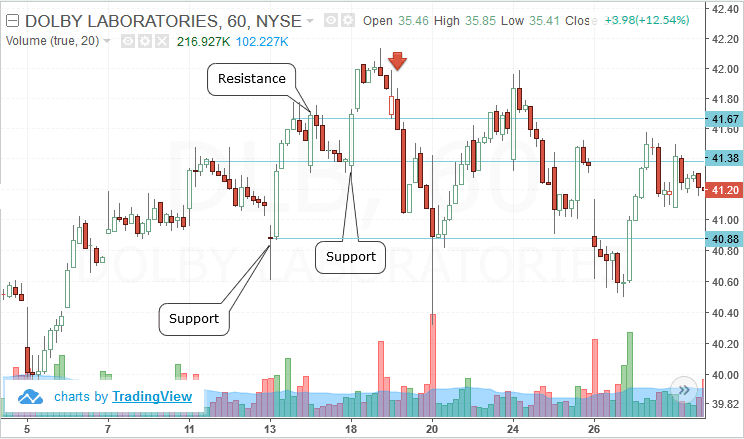
Once this set up is identified, the next step is to quickly find the nearest support and resistance levels.
Day trading a blow-off top pattern" width="744" height="439" srcset="https://f.hubspotusercontent10.net/hubfs/20705417/Imported_Blog_Media/Day-trading-a-blow-off-top-pattern-2.png 744w, https://f.hubspotusercontent10.net/hubfs/20705417/Imported_Blog_Media/Day-trading-a-blow-off-top-pattern-600x354-2.png 600w, https://f.hubspotusercontent10.net/hubfs/20705417/Imported_Blog_Media/Day-trading-a-blow-off-top-pattern-300x177-2.png 300w" sizes="(max-width: 744px) 100vw, 744px">
Day trading a blow-off top pattern
The above chart shows a resistance level and two support levels.
A short position is taken after a few sessions later, price closed below the previous resistance level. The closure below this level at $41.67 indicated that the resistance did not turn to support, so inferring that price could fall further.
This bearish bias was already validated by the blow-off top pattern, and builds our base case scenario of a downside move. A short position is then initiated on the next session’s opening price targeting the immediate support at $41.38 and $40.88. By the time the first target is reached, the stops, which would be placed a few ticks above the $41.80 price level would be moved to break even.
You can see how price bounces back modestly to retest the previous support at $41.38 and then reverses lower to the next support at $40.88.
Let’s look at another example.

candlestick-2.png" alt="Blow off top pattern with a doji candlestick" width="743" height="436" srcset="https://f.hubspotusercontent10.net/hubfs/20705417/Imported_Blog_Media/Blow-off-top-pattern-with-a-doji-candlestick-2.png 743w, https://f.hubspotusercontent10.net/hubfs/20705417/Imported_Blog_Media/Blow-off-top-pattern-with-a-
doji-candlestick-600x352-2.png 600w, https://f.hubspotusercontent10.net/hubfs/20705417/Imported_Blog_Media/Blow-off-top-pattern-with-a-doji-candlestick-300x176-2.png 300w" sizes="(max-width: 743px) 100vw, 743px">
Blow off top pattern with a doji candlestick
In the above chart for SL Green Realty (SLG), you can see the blow off top pattern resulting in a doji. Here the open/close are at an intraday high although the previous session’s high was the intraday high. Still, this pattern is validated by the strong surge in volume.
Two sessions later, you can see the first resistance level failing as support, which was the cue to short SL Green Realty at the close with stops at the high of the candlestick, above 119.04 resistance. The downside targets are set to the initial minor support at 118.35 that was plotted and then the next major resistance level that was likely to turn to support at 117.59 followed by a strong support/resistance level at 116.55
After the blow-off top, price falls towards the first and second targets and then reversed, in all likelihood stopping out the final position of the short trade at break-even. Despite this move, the blow-off trade resulted in capturing decent profits.
A blow-off top pattern can also be traded with the help of indicators as well. In the next example below we have the stock chart of Valeant Pharmaceuticals (VRX). Here the blow-off pattern is distinctive because of the strong price action to the upside but the top failed to hold with price moving back to where the stock opened.
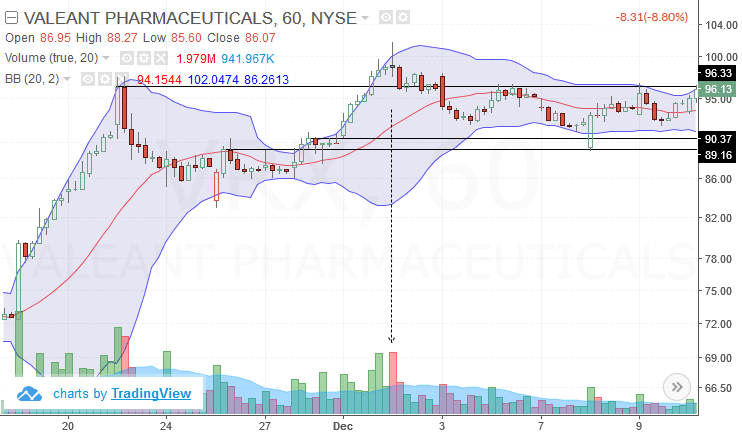
Trading blow-off tops with Bollinger bands
The above chart shows Bollinger bands that are added as well. This indicator can be helpful in aiding to find a blow-off top pattern because you will quite often see price spiking above the upper Bollinger band (as seen in the above chart).
Applying the rules of trading the blow-off top pattern, we again look for support and resistance levels that stand out. The first resistance level at $96.33 is identified and this is the cue. It the resistance fails to turn to support, we can look to shorting VRX.
As expected, price attempts to form support but soon fails and closes on a strong bearish candlestick. A short position is then taken targeting the first support at $90.37 and $89.16. In the above example, you can see how price retraces back to the failed support but this time forms resistance. This is another cue to short the position and more positions could be added with a tight stop at $98.00.
Price then quickly starts to ease lower, hitting both the targets at $90.37 and $89.16.
The above three examples should make it easier to understand how the blow-off top pattern is formed and how day traders can use this pattern to short the positions to capture some profits that the markets can given.
Trading tips to consider when trading blow-off tops
While the blow-off tops can potentially yield strong profits in a short span of time, being careless in waiting for the right set ups or being complacent in setting the stops correctly or even failing to book profits can result in losing trades, eventually making you to abandon the idea of trading blow-off tops.
One of the most telling signs with a blow-off top pattern is the surge in volume that stands out. This is even visually not hard to miss and therefore makes it easy to tell if a blow-off top is valid or not. As with the trading approaches mentioned in this article, traders should wait for further confirmation before jumping into the trade. It also helps if you monitor the stock in question for any news that might have resulted in the spike in price causing the blow-off top. This can usually happen closer to the earnings report release of the stock or any unannounced news such as regulatory reports or lawsuits or other issues that can cause a strong knee-jerk reaction in prices.
Another important factor that day traders should bear in mind when fading the blow-off top pattern is that, the support and resistance levels need to be plotted quickly. Typically you can expect price to start moving lower within 2 – 4 sessions after the blow-out top pattern occurs on the intraday chart. And since we are making use of the 1-hour chart, day traders have just about one hour on average to research into the stock to see what caused the surge in price and to identify the support and resistance levels before pulling the trigger.
This might seem simple but if you add in a few stocks into the watch-list you can see how the pressure can cause you into making mistakes that can be expensive. Therefore day traders should be patient and disciplined to stick to monitoring one or two stocks at best and to focus on fading their respective blow-off top patterns to make consistent profits over time.
As with any trading strategy, practice makes one perfect and the blow-off top pattern is no exception to the case either. Traders can make use of a simulated trading environment to test the blow-off top trading pattern to initially practice how to trade this pattern followed by making a few simulated market trades to ensure that you are familiar in trading with the blow-off top technical chart pattern.
Related Trading Strategies
Related Trading Strategies
Blow-off top fading works alongside other reversal and momentum strategies. Deepen your skills with these guides:


 Day Trading Basics


