If you trade the opening bell, then you are quite familiar with the morning gap.
What you might not be so accustomed to is the gap that fails and when I say fails – fails miserably.
This type of gap is known as the exhaustion gap. In this article, I will cover the 7 steps to recognize one and exhaustion gap trading strategies that will help you turn a profit when trading the pattern.
What is the Exhaustion Gap?
The exhaustion gap resembles most other gaps in the morning, but what makes the gap special is the swiftness of the reversal.
The exhaustion gap usually appears at the end of longer price trends.
When day trading, you can truly make the most money if you are able to catch a stock right when it’s starting a new price trend. This is what makes exhaustion gaps so attractive to day traders.
Psychology of the Exhaustion Gap
The exhaustion gap represents the herd mentality at its worst. Everyone is running to sure profits without any thoughts of the potential pain of being wrong.
We’ve all seen it on the chart. The huge 6% 5-minute up bar that closes at the high. It’s so easy to give into this temptation and click the buy button and hop on the “money train”.
The combination of the lack of conviction when opening the trade and the rabid greed is what ultimately leads to the fierce selloff.
Once the stock begins to stall, everyone and I mean everyone realizes that the downside risk is too great. No one of course thought through this as they were entering the position.
The lack of instant gratification and the newly perceived risk, leads to a number of retail traders all sending sell orders to the market.
At first, traders will attempt to enter limit orders, but the pain will be too great as the bright red background color lights up the time and sales window. This is when the pattern really begins to hurt people.
Traders will then start entering sell at market. This need to just get out is what drives prices lower with no regard for human life.
Volumes are crucial for recognizing the pattern. It is likely that the volumes are at a moderate level on the opening gap. This price and volume action doesn’t last long as traders become anxious with the lack of further price movement.
Once the exhaustion gap begins, the volumes will pick up significantly.
Enough theory, let’s dig into a real-life example:
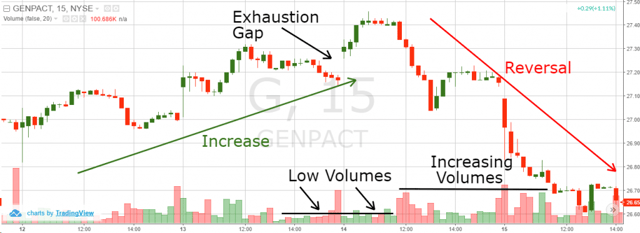
Exhaustion Gap
The chart begins with a gap through $27.30. Everything looks normal until the price action creates a bullish gap with relatively low to moderate trading volumes.
Although volumes are low, the price continues to increase. This is a possible indicator that move up is fueled by retail traders.
Then you see a number of candles with long upper wicks, which is a sign that the bulls are unable to sustain any positive momentum.
Then the inevitable starts and Genpact begins to selloff with high volume. The exhaustion gap literally started a two-day selloff eclipsing the start of the up move.
Types of Exhaustion Gap
There are two types of exhaustion gap patterns based on the direction of the trend and their potential – bearish and bullish.
Bearish Exhaustion Gap
The bearish exhaustion gap develops at the end of strong up trends.

Exhaustion Gap 2
Does the above chart look familiar? Well it should, it was the last example we covered, which is a great example of a bearish exhaustion gap.
Bullish Exhaustion Gap
The bullish exhaustion gap develops at the end of strong bearish trends.
This gap implies that the sellers are losing momentum and buyers are picking up steam. This creates long opportunities on the stock chart.
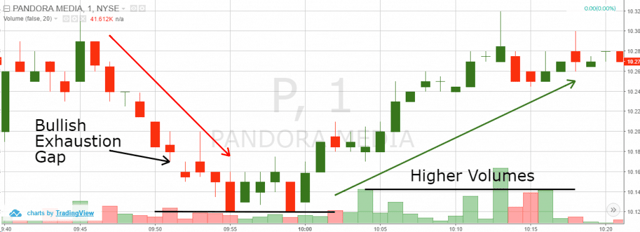
Bullish Exhaustion Gap
Notice the gap occurs at the end of a bearish trend with low volumes. Then the price reverses and at the same time volumes increase. This confirms the presence of a bullish exhaustion gap pattern.
7 Steps to Recognize and Trade the Exhaustion Gap
Now that you are familiar with the structure of the exhaustion gap, we will cover the 7 steps to recognize and trade the setup.
Step 1: Find a Trend
The pattern cannot be valid in the absence of a trend. Therefore, the first step you should take is to find a trending stock.
Step 2: Identify Low Volumes during a Gap
The next time you see a gap in the direction of the primary trend, you should closely analyze the trading volumes of the stocks. If the volume is light, this should spell potential trouble on the horizon.
Step 3: Identify Volume Increase during Reversal
If the price begins to roll and the trading volume begins increasing relative to the opening gap – then a reversal is highly likely.
However, this is not enough to confirm the pattern and to open a trade.
Step 4: Confirm the Exhaustion Gap
There are two methods for confirming the pattern.
The first one is by spotting a gap, which is in the opposite direction of the exhaustion gap. When the trend reverses, the opposite force is so strong that the price gaps opposite to the trend.
This sometimes creates an island reversal candle pattern on the chart. If you manage to spot an opposite gap, or even an island reversal candlestick pattern, then you have the strongest confirmation of the exhaustion gap.
The second way you can confirm the pattern is with a breakout through the opening gap range.
When the price action breaks the range opposite to the prior trend, then you have confirmed the pattern.
Example: If the previous trend was bullish and you get a bearish exhaustion gap, then the confirmation comes when the price breaks the lower level of the gap.
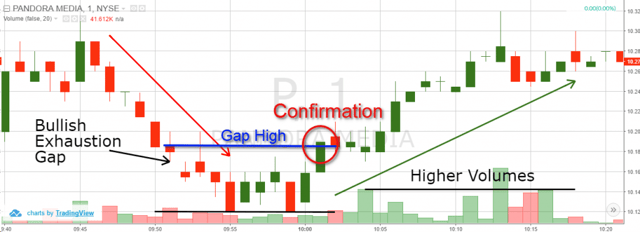
Exhaustion Gap Confirmation
The blue horizontal line on the image above shows the high point of the bearish exhaustion gap. The confirmation of the pattern comes in the red circle when the price action breaks the gap high upwards.
Step 5: Open a Trade
After you confirm the validity of the exhaustion gap, it’s time to open a trade.
If the exhaustion gap is bearish, then you should open a short position.
If the exhaustion gap is bullish, then you should open a long trade.
Simple enough, right?
Step 6: Create a Stop Loss Order
Make sure you always use a stop loss order when trading the pattern.
You have to remember that you are trading a high volatility stock. This means that if things start going against you, they can do so in a hurry.
If you have a bullish exhaustion gap, your stop should be located below the bottom created at the time of the reversal.
If you have a bearish exhaustion gap, which you trade short, your stop should stay above the top created during the reversal.
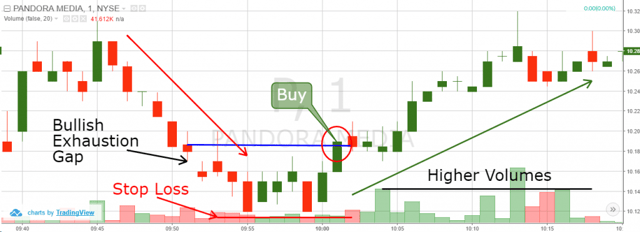
Exhaustion Gap Stop Loss Order
The image above shows where your stop loss order should be placed. After the price action breaks the gap high and gives confirmation, you are supposed to buy the stock. At the same time, you should place a stop loss order below the bottom in the moment of the reversal. This is shown with the red horizontal line on the image.
Step 7: Exiting the Trade
The classical gap trading approach suggests that you exit your trades when the price action completes a move equal to the size of the gap. However, when trading the pattern you are likely entering a position right at the beginning of a new trend.
So, if you are looking for a conservative trade, exit your position at a price move equal to the size of the gap.
However, if you are looking to open yourself up to more risk, monitor price action and support/resistance levels for when to get out of the trade.
Exhaustion Gap Trading Example
Now that we discussed all 7 steps to recognize and trade the exhaustion gap, I will show you a real trading example of this pattern.
Refer to the image below:
Bearish Exhaustion Gap Trading Example
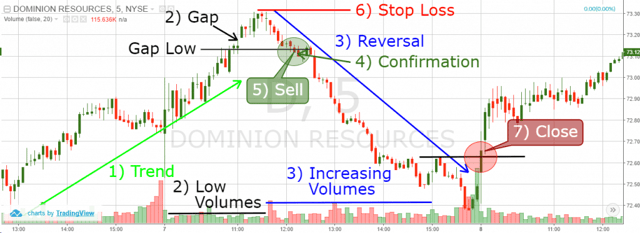
Above you see the 5-minute chart of Dominion Resources for June 7, 2016. The image illustrates an exhaustion gap trade.
- The image starts with a bullish trend, which is marked by the green bullish arrow on the chart.
- Suddenly, the stock creates a bullish gap, which is in the direction of the trend. Meanwhile, the trading volumes are very low, yet the stock keeps creeping higher.
- The price action then reverses while the volumes are increasing.
- The confirmation of the bearish exhaustion gap comes when the price action breaks its lower level.
- We need to sell the Dominion the moment of the breakout through the gap low.
- The stop loss order of this trade should be located at the top above the gap as shown on the image.
- See that the price creates lower highs on the way down, which indicates a bearish trend. Suddenly, one of the price’s highs gets broken upwards and we close our trade.
Conclusion
- The gap signalizes that the trend might be exhausted, which creates a strong reversal potential on the chart.
- Therefore, traders use the exhaustion gap to trade trend reversals.
- The gap represents a big decrease in the people who trade with the trend, followed by a strong opposite force.
- There are two types of exhaustion Gaps:
- Bearish: starts with a bullish trend, bullish gap and a bearish reversal.
- Bullish: starts with a bearish trend, bearish gap and a bullish reversal.
- The 7 steps for recognizing and trading the Exhaustion Gap are:
- Find a Trend
- Identify Low Volumes during a Gap
- Identify Increasing Volumes During the Reversal
- Confirm the Exhaustion Gap
- Open a Trade
- Place a Stop Loss
- Exit the Trade
If you are interested in more real-life examples, I was able to find another write-up by a trader named Matt Trivisonno. He did a pretty good job laying out the details of the pattern.


 Awesome Day Trading Strategies


