Basics of Elliott Wave Theory – Learn the Essentials
Jul 22, 2018
Written by: Al Hill
In this article we will first cover the Elliott wave basics and structure. The goal of this article is to help you learn Elliott wave theory and give you the foundation to further explore and test the theory.
Next, we will take a look at how to apply the theory to day trading.
Elliott wave theory is based on the premise that markets form repetitive patterns or cycles.
Ralph Nelson Elliott developed the Elliott wave concept of trading in the late 1920’s. The theory proposed an alternative view to the notion that markets are random.
Based on this theory, investors could anticipate and predict potential cycles in the market.
The most challenging part of Elliott wave analysis is that it’s highly subjective. Where you may see the next bear market starting, another trader will see a double bottom setting in before a massive wave one.
This need to quickly assess the pattern in complex markets is what makes the theory so challenging to master.
The Elliott wave analysis also draws upon the Dow theory.
The Dow theory, postulated by Charles Dow also states price moves in waves. Charles Dow called these waves trends.
There is a strong influence of the Dow Theory of trends which in Elliott wave trading terminology are nothing more than various degrees of trends.
Elliott wave theory goes into great detail regarding the study of the fractal nature of the markets.
Now that we have tackled a brief overview, let’s dig into the principles of the theory and key retracement levels which categorize the waves.
Principles of Elliott Wave Theory
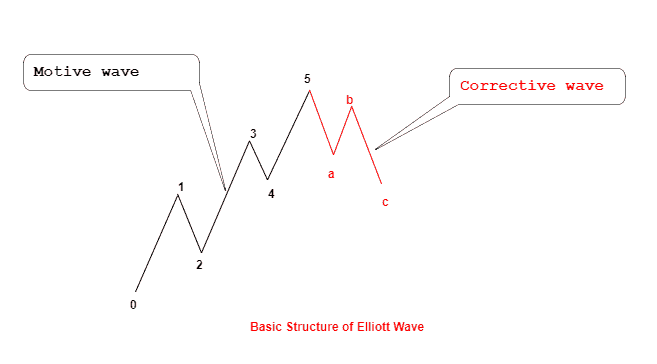
Elliott wave is made up of two wave types; impulse or motive wave and the corrective wave. An impulse or motive wave is one that moves in the direction of the trend. A corrective wave, as the name suggests, moves against the direction of the primary trend.
The classic Elliott wave structure is comprised of five waves. The five waves include three motive waves and two corrective waves. The Elliott wave cycle forms on smaller time frames as well giving its fractal nature.
A number is assigned to each wave in the Elliott wave which follows a unique concept. As you might notice, Elliott wave theory involves counting of the waves and uses Fibonacci retracement levels.
Elliott Wave Degrees
Wave degree is a name given to the waves forming in a cycle. Based on the counting of waves, each wave is given a distinct naming convention as shown below.
Grand Super cycle ((I)) ((II)) ((III)) ((IV)) ((V)) ((a)) ((b)) ((c)) ((w)) ((x)) ((y)) ((z))
Super cycle(I) (II) (III) (IV) (V) (a) (b) (c) (w) (x) (y) (z)
The chart below shows an example of the Elliott wave.
Basic structure of the Elliott Wave
In the naming convention of the Elliott wave theory, price tends to alternate between the impulse and motive waves. The impulse waves which move in the direction of the trend are divided into five lower degree waves. Typically, the waves numbered 1, 3 and 5 are impulse waves and 2 and 4 are corrective waves.
Elliott Wave Analysis and Market Psychology
One of the unique things about Elliott wave analysis is that it gives you the ability to forecast market trends.
While some might call it “wave counting” the fact is Elliott wave is able to quantify and predict market movements based on human psychology.
The wave three for example is often attributed to a strongly bullish or a bearish market.
The wave three starts when institutional money starts to flow in. Along the way, the general retail trading population starts to identify this trend. Typically, news channels and various market reports are released that further support the wave 3 price action.
By the time the general trading community starts to pile into the trend, it is often towards the end of wave 3. As a practitioner of Elliott wave, identifying wave 3 in its initial stages can produce amazing results.
Elliott Wave Rules
The Elliott wave rules are based on the retracement levels of the waves. Contrary to popular opinion, Elliott wave rules are clear. The rules are summarized below:
Wave 2 should not retrace the first wave
Wave 3 is never the shortest of the three impulse waves
The fourth wave should never overlap the first wave
Wave 3 is often a 1.618% extension of wave 1
Fibonacci Retracements and Elliott Waves
Using the Fibonacci levels, the above mentioned Elliott waves can be further fine-tuned.
The retracement of Wave 2 is often around 50%, 38.2% or 61.8% of wave 1. As long as wave 2 does not fully overlap wave 1, it can be qualified as an Elliott wave. In some cases, wave 2 tends to retrace below 61.8% as well.
Wave 3, which is the strongest and the longest of the Elliott waves is often 1.618% Fibonacci extension of wave 1. The wave 3 is the strongest because this is when the masses tend to ride the wave.
Wave 3 is also an impulse wave.
Wave 4, which is a retracement to the wave 3 often terminates around 14.6% or 23.6% or 38.2% of the third wave.
The fourth wave allows traders to add to long positions.
The fifth wave, which is often the last before a major correction occurs is sometimes equal to the distance of wave 1.
In the next section, you can see an example on how to use Fibonacci retracement levels and Elliott wave theory.
Applying Fibonacci Levels to Elliott Wave
After wave 1 and 2 are formed, traders can anticipate the levels where the third wave will end.
Typically, on a breakout of the high of wave 1 (or the low of wave 1 in a downtrend), traders can go long and book profits along the 127.2% and 168.1% of wave three.
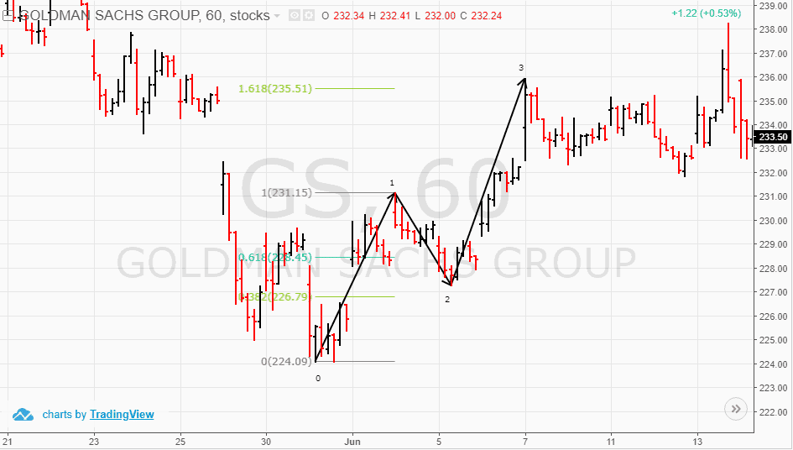
The next chart below shows the Elliott wave analysis in the simplest form.
Simple Elliott Wave Theory Example
In the above chart you can see that wave 2 retraces wave 1 but it does not overlap the first wave completely.
The third wave eventually rises to 1.618% extension of the first wave. From here on, traders can anticipate where the next decline can occur.
The best way to trade this set up is to wait for the completion of the second wave. When price reverses from wave 2, traders can initiate long positions after the high of the first wave is breached. The upside target is set at 1.618% extension of the first wave.
Other methods of using support and resistance levels can also help to identify and coincide with the potential turning points in price.
Elliott Wave and its Use in Chart Patterns
You can use the concept of Elliott wave theory with other chart patterns such as triangles and diagonals. In chart pattern terminology, the ending diagonal is similar to a rising wedge.
A rising wedge pattern forms at the end of a rally. This pattern emerges after the strong momentum led rally becomes exhausted. The sharp moves in price action leads to a diagonal or a rising wedge pattern. The breakout from this rising wedge pattern leads to a sharp counter trend move.
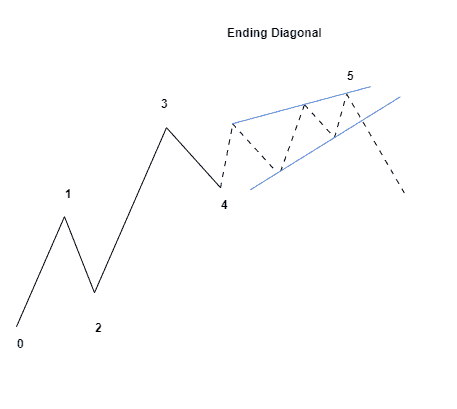
The diagonal wave is part of the motive wave. This is a subdivision of wave 5 to a smaller degree. Within wave 5, you can further count the waves one degree smaller. The chart below illustrates the ending diagonal or the rising wedge pattern.
Ending Diagonal Pattern with Elliott Wave
The ending diagonal pattern is a special type of motive wave. You can recognize or anticipate an ending diagonal pattern during the fifth wave. Price action tends to be sharp and rapid around this wave. The ending diagonal shown above is also called a rising wedge which is a bearish pattern. The opposite of the above (in a downtrend) is a bullish wedge pattern.
While the rising and falling wedge pattern can be traded in isolation, combining the Elliott wave count brings a higher probability for the trade.
As the Elliott wave pattern already signals the support and resistance levels from the turning points from the previous waves, the target price level can be easily identified.
How to Apply Elliott Wave Theory to Day Trading
One of the unique aspects of the Elliot wave analysis is that it works with day trading as well. Due to the fractal nature of Elliot waves, traders can find the right patterns across different time frames.
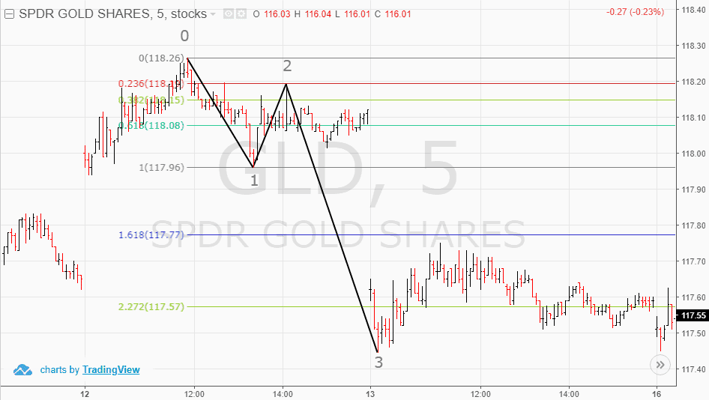
For day trading with Elliott waves, traders can choose the 1-minute chart all the way to the 60-minute chart to identify the Elliott waves. The chart below shows an example of a 5-minute chart which is popular among day traders.
Elliott Wave Day Trading Example
In the day trading example above, you can see how we start by counting the Elliott waves. After the second wave is completed, short positions are taken when price extends below the low of wave 1. This marks the third wave, which is the longest of the Elliott waves.
In the above example, you can see how the third wave reaches past the 1.618% extensions leading all the way to 2.272% Fibonacci extension.
You can use similar strategies across different markets applying the same concepts.
Trading with Elliott Waves – Conclusion
Elliott wave trading is one of the oldest methods of analyzing the charts. The concept of using Elliott waves is very unique with other types of technical analysis. Before getting started with Elliott wave trading, it is best that the trader is acquainted with the general principles of technical analysis.
Due to the subjectivity of the Elliott wave theory, traders need to rely on their experience and familiarity of this principle. Because Elliott wave trading is open ended, you can easily combine the counting of waves within an existing strategy.
The benefit of using Elliott wave trading comes from the fact that it can further validate your analysis and increase the probability of your trades and positions.
There are many different types of waves that one can use with Elliott wave trading. However, following all these variations can be confusing if not make it more complicated. To be successful trading with Elliott waves, the best place to start is with the simple wave count.
Due to the fact that Elliott wave analysis combines counting of waves and market psychology traders will find this approach to be quite unique. If you strip away the complex terminologies that comes with Elliott wave trading, you will find that there is a stark similarity to the Dow theory of trends.
Once you are familiar with identifying wave 1 and 2 set up and comfortable in trading the third wave, you can advance to the more complex Elliott wave patterns.
The 3rd wave extension is drawn upon the Elliott wave theory. The Elliott Wave theory is a rather simple and a straight forward theory that was created by Ralph Nelson Elliott. The Elliott Wave...
How to Use Trendlines with the Elliott Wave Pattern
Trend Lines Definition Trend lines are one of the oldest technical indicators. Trend line indicators are used to identify and confirm existing price trends. They can be drawn on any time frame and...
7 Things We Learned From the Stock Market Crash of 2008
September 29th 2008 was the day when the stock market, as represented by the Dow Jones Industrial Average fell 777.68 points during the day, marking the stock market crash. It was the biggest point...


 Day Trading Indicators


