You can never call Alexander Elder a humble guy as he decided that the best name for his indicator would be that of his own last name.
I can however appreciate the fact that Alexander believed in his own analysis so much, that he was willing to associate his own name with his findings.
The Elder’s Force Index is an oscillator, which attempts to identify the force or strength of a move. Elder felt that this was best calculated by factoring in a stock’s volume and comparing the current period close to the previous period close.
This tight comparison allows the indicator to perform a bar-by-bar assessment of a stock’s performance.
Elder’s Force Index Formula
The EFI formula is about as straight forward as you can get with technical analysis these days.
(Today’s Close – Yesterday’s Close) * Volume = Elder’s Force Index
As you can imagine, if we are talking about a stock with high volume, the Elder’s Force Index readings will be pretty high. Therefore, when comparing different charts, a higher or lower Elder’s Force Index value does not mean one stock has more force than another. Remember, the reading is specific to each stock as there is no upper or lower boundary on the Elder’s Force Index like other oscillators.
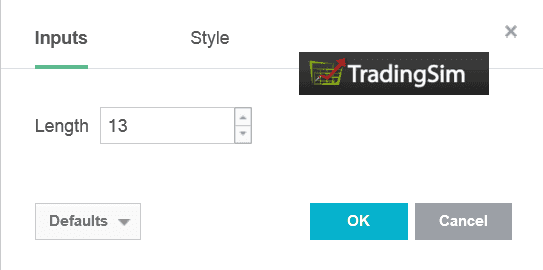
Next, you need to decide on the look back period for the indicator, which will give you the average over a set number of Elder’s Force Index readings. The default value used by most trading platforms is 13, which is what we will be using for our chart illustrations.
length of elder’s force index
Day Trading Strategies using the Elder’s Force Index
When you read about the Elder’s Force Index indicator on the web and in books, you will find the standard trading strategies around waiting for the indicator to cross above or below the 0 line.
Another common strategy is to look at divergence of the Elder’s Force Index with the current price trend to gauge when a stock is likely to have a counter move, as the internals of the move are shaky.
These are all your plain vanilla trading strategies, which add some value. However, I will be covering some uncommon strategies that you can explore for how to use the Elder’s Force Index when day trading, which will hopefully give you an edge.
Strategy # 1 – Extreme Readings
Since the Elder’s Force Index is tied to volume, when you have volume surges the indicator will spike violently. As day traders, we make the most money trading during volatile times.
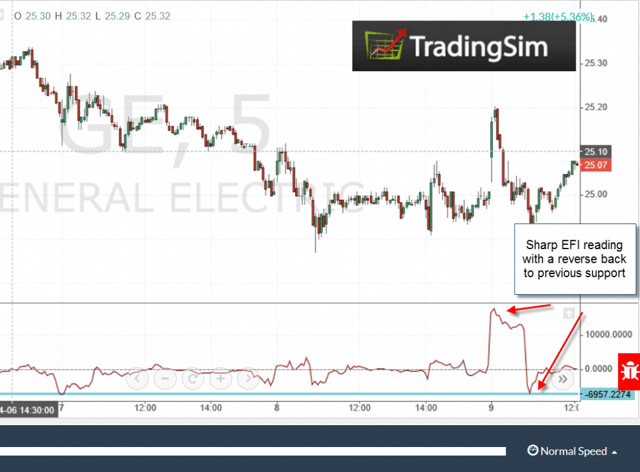
To this point, the setup requires that you wait for the indicator to produce an extreme reading to either the up or down side. Again, these high readings just mean you have had sharp price movement with increased volume.
Next, you want to see a reversal from the extreme reading and then the EFI shoot back to a recent high or low area. Please look at the below illustration to help with this point.
EFI Extreme Readings
I’m guessing you are wondering what happened next? Well, let’s take a look.
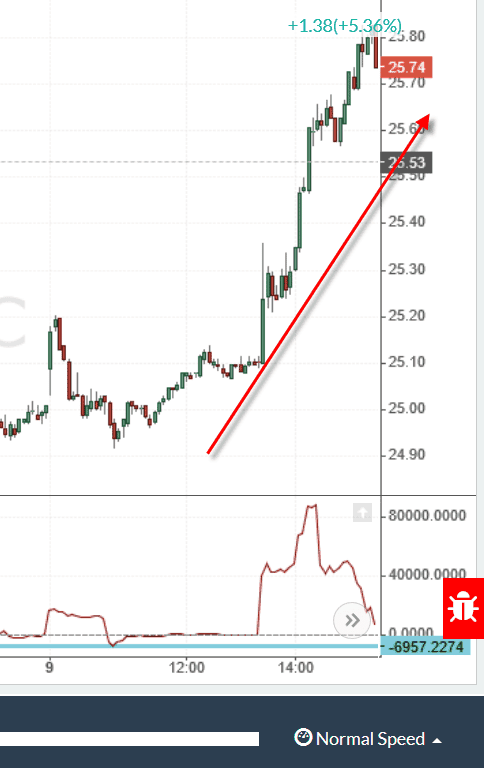
Much Higher
GE managed to make a significant run after the fake out. Notice how the most recent Elder’s Force Index reading is so much higher than the previous gap and reversal period that the previous extreme reading now looks like a bump in the road.
Again, the Elder’s Force Index has no ceiling, so the indicator can run if given the right circumstances.
Recap of Strategy # 1 – Extreme Readings
Look for an extreme high or low reading
The EFI needs to quickly reverse back to a recent peak or trough
Buy or sell the stock once it reaches the recent peak or trough
Strategy # 2 – Sell the pullback to the trend line
This strategy is a bit involved, so stay with me. I’m pretty sure you are all familiar with the concept of drawing trend lines on indicators. Funny enough, you can see support and resistance zones the same way the show up on price charts when using the Elder’s Force Index.
Since the Elder’s Force Index can trend in one direction without boundaries, the EFI will often produce longer-term trends. As a day trader, when you are looking for a midday setup, which requires identifying longer patterns, as you do not have the volatility present in the morning, the EFI can provide insight into a break in trend.
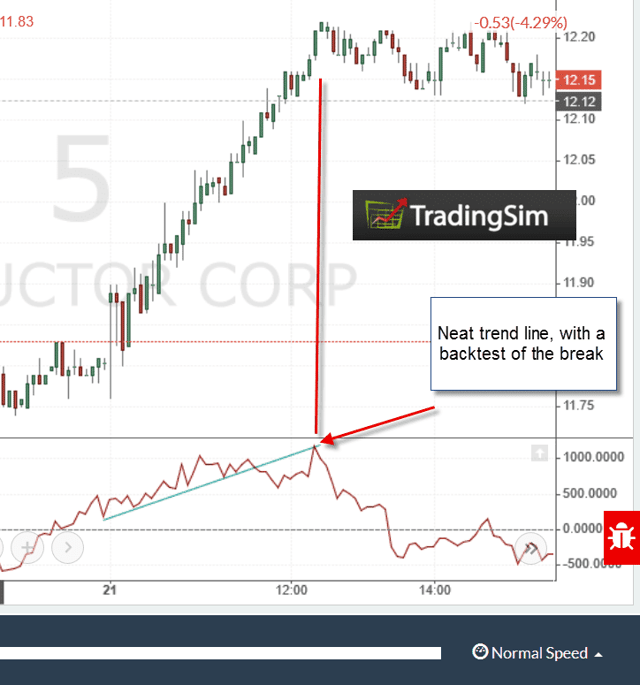
Trend lines on the EFI
If you were in the stock and were only looking at the price action, you really had no way of knowing the fun ride was coming to an end. However, the Elder’s Force Index had a break below a trend line, which was an early indication that the force or strength behind the move was dissipating.
The same as in price action, once the Elder’s Force Index back tested the uptrend line, the price went flat. Longs that entered the position in the morning could have used this as an opportunity to exit their position and book profits.
Recap of Strategy # 2 – Sell the pullback to the trend line
Stock is on a run for more than a few hours. This will produce a longer up or down trend for the EFI
Exit existing positions on a break of the trend line
If you are looking to go counter to the trend, wait for a back test of the trend line to open a position
In Summary
I just spent the last 30 minutes looking for additional creative strategies for how to trade the EFI and I kept coming up with blanks. The standard divergence analysis just isn’t enough for me these days.
Based on the above two strategies, take a look at your existing systems and see if there is anything there you can use in your trading toolkit.
The key thing to remember is that you want to user the Elder’s Force Index to really gauge when a stock or trend is moving sharply. The last thing you want to do is try to use the indicator when the market if flat.
Seeing that the indicator literally has force in its name, you probably want to make sure you use the market to again assess strong trends.
How to Trade Using the Average True Range Indicator
Story Highlights The average true range (ATR) is a great tool for determining the level of volatility across stocks to align your investment choices with your risk profile. The ATR should not be used...
5 Examples of Keltner Channels versus Bollinger Bands
I am a self-proclaimed ATR fanatic, yet I have not explored Keltner Channels. The Keltner Channel is a lagging on-chart indicator that uses a combination of exponential moving averages and the...
ARMS Index – Brief Overview The Arms index is a market breadth indicator used mostly by active traders to forecast intraday price movements. The Arms index was developed by Richard Arms in the 1960’s...


 Day Trading Indicators


