Drawdown risk is something that a trader cannot truly avoid, regardless of whether you are trading stocks or futures. There are many other types of risks such as market risk, geo-political risks, liquidity risk, counterparty risk and so on.
Drawdown risk belongs to the same category. Along with the risks previously mentioned, drawdown risk can directly impact your performance as a trader. In stocks, drawdown will impact your portfolio as well.
Drawdown has become one of the key risks that have become relevant to both traders as well as investors. Due to the fact that it affects your performance and portfolio, drawdown is one of the key metrics.
Whether you are an active trader or an investor you should be aware of the risks of drawdown. Understanding drawdown will help you in two ways.
First, it will make you a more disciplined trader. It can help you to manage your risk in a better way. Risk management is one of the key things for a trader, whether you are a day trader or a swing trader.
Second, understanding drawdown risk will help you in evaluating a potential fund (mutual fund, ETF, etc.). It will tell you how risky the investment can be. As a result, you can then evaluate whether the fund can compliment your risk tolerance.
Traders usually frown upon drawdown, but it is not that bad as it seems.
But before you get all negative, remember that drawdown is actually a helpful indicator. It is a metric that can help you to eventually be successful in managing your trades. It can also be a metric that will help you to avoid choosing the wrong fund to invest in.
So let’s learn a bit more in detail about what a drawdown is and why it concerns you.
Drawdown – The definition
Let’s start by defining what a drawdown is.
In the very simple terms, drawdown or drawdown risk measures how long it takes for a portfolio or fund to recoup its losses. Anyone who has been trading would know that losses are an integral part of the cycle.
If you think you would get rich by investing in stocks then you are thoroughly wrong. Losses are winnings are part of the trading game.
A drawdown measures the peak to trough decline during a specific period of time. This can be in a stock, a fund or your trading, or a retirement account.
Drawdown is represented as a percentage from the peak to trough decline. In a way, drawdown means the amount of decline in a security or a trading account. Some would call it a correction. So when you hear about the S&P500 index falling 10%, this is in a way a measure of its drawdown: the difference from the peak to trough.
The chart below shows an example to help you understand drawdown better.
We are looking at the S&P500 total return index drawdown.
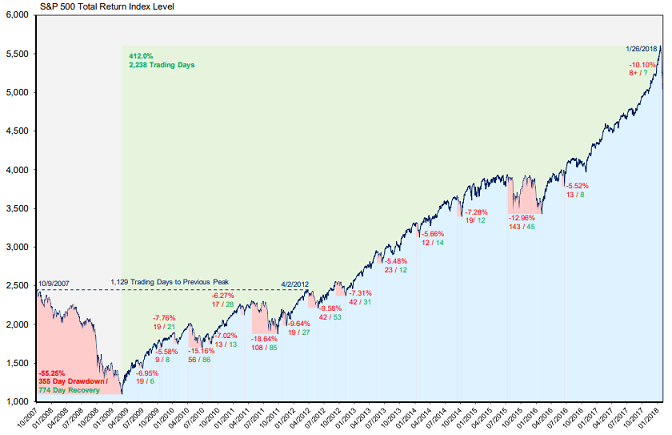
S&P500 – Total return index level drawdown (Source: washoecounty.us)
The above chart shows the total drawdown from the peak to trough with more 5% declines. An important point in the above chart is the first drawdown. The S&P500 index rose to 2,500 in late 2007. After this, the index fell sharply to just above $1000.
The total drawdown from $2500 to just above $1000 is a 55.25% drawdown.
It takes the S&P500 1,129 days to break the previous high, or in other words to recover from the drawdown.
Drawdown is one of the most important inputs for assessing the risk associated with an investment. Many traders overlook the drawdown factor and only focus on the gains.
Drawdown – Understanding how it works
Drawdown measures the peak to trough decline over a specific period of time. The chart below shows another example but in a more simple way.
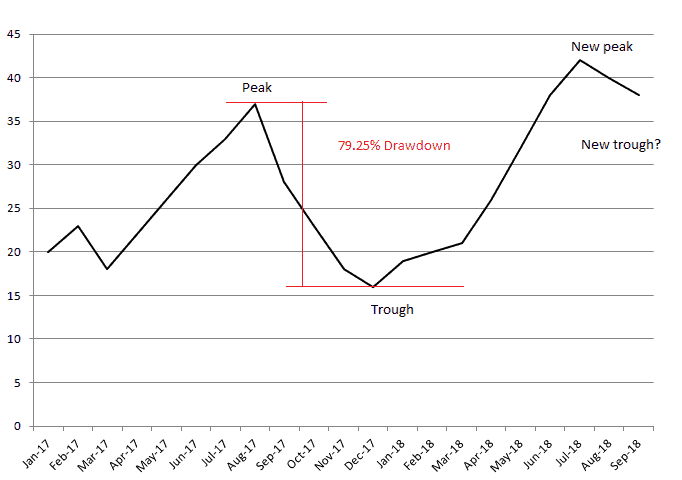
Simple explanation of drawdown
The above chart can be anything. It could be your trading account or just the price of a stock. Drawdown is common, as you should know by now.
The chart shows that price initially hit a peak of near 37. After this, the price fell sharply to around 16. This was a new trough in the price chart. When you measure the peak to trough, you can see that the drawdown was 79.25%.
This means that the price declined by 79.25%. In other words, this is the drawdown on the security or a trading account.
Drawdown knocks you off your feet
A drawdown is common. In fact, this article takes a closer look into the drawdown for the S&P500 index and gives a different output.
According to the article, the S&P500 has a 5% – 10% drawdown 12.8% of the time. A 10% – 20% drawdown happens 13.1% of the time. Finally, a 20% or higher drawdown occurs 23.1% of the time.
It is important to stress on this fact a bit more.
For many who look at the S&P500 chart, one might think that the index has been steadily progressing higher. But that is how it looks when you look at the long-term performance. A 5% drawdown is not uncommon to see on the S&P500 index.
Stocks go up in general, but it is only the mind that is tricking you, especially when you use the log scale.
Drawdown is something a trader or a security or a fund cannot live without. It happens all the time. The trick is in recovering from a drawdown.
Or as the famous Rocky Balboa said, it is not how hard you hit, but how many times you get hit but still stand up.
A drawdown is the same; standing up every time the markets knock you down!
Why is a drawdown important?
A drawdown is important for a number of reasons. Drawdown can help you to determine the financial risk of an investment or a security. Drawdown is also equally important when you analyze a trading system. As most day traders often keep looking for the next best trading system, drawdown can reveal some important information.
Drawdown is often misunderstood in the trading community. An account with a huge drawdown is often disregarded. Traders believe that trading systems with big drawdown means it simply doesn’t work. That is incorrect.
A drawdown can help you to understand a security or an investment or a trading system’s risk to reward. Drawdown tells you the volatility of the trading system. And through the volatility, you can then assess the risk-reward performance.
There are many ways a drawdown can be represented. For example, the Calmar and Sterling ratios are widely used to assess a security.
The ratios provide a comparative analysis of a security or a fund from a risk-adjusted assessment.
If you like to go into the details, this statistical whitepaper is a great starting point.
As a trader, when you start off with trading, you obviously want to win on every trade. But the reality is different. Regardless of what trading system you use, or how good your analysis is, you can’t avoid a loss.
Experiencing drawdown periods as a trader
Accepting losses is one of the most important things when it comes to your trading success.
When trading, and especially during a drawdown period, the peak to trough can come in just one trade. This is not surprising. In some cases, a drawdown can occur over a series of trades.
Thus, as a trader, you should know not just your drawdown but also in how many series of trades the drawdown occurs. This is a good way to look back and assess your trading system. The number of winning trades obviously takes you to a peak. Likewise, the number of losing trades can take you to the trough.
Understanding this is important to control your emotions and also to know your trading system better.
Here is an example of some statistics of a trading system.
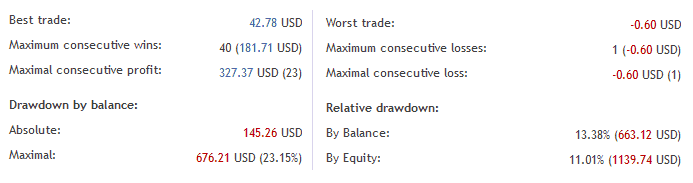
Drawdown trading statistics
The above statistics are easy to understand.
Let’s focus on the drawdown section.
It shows you that the above account had a maximum drawdown of $676.21. In other words, the drawdown was 23.15%.
What the above data point tells you is that there is a risk of losing approximately 23% of your trading capital. Note that there are other sub-headings. The one we are looking at is the drawdown by balance. This is taken from the realized profit (the actual amount you have in your account).
On the right side, you can see the relative drawdown by the balance and equity. The drawdown by equity means the drawdown in the open positions that you have. In the above example, the relative drawdown by equity is 11.01%.
This means that the trading system has the potential of 11.01% drawdown when trading (and with unrealized profits).
The recovery factor in a drawdown
There is another metric called the recovery factor. The recovery factor measures how fast an account can recover from a trough to post a new peak.
Of course, a system with high drawdown and a high recovery factor means that it is a volatile trading system. Depending on your capital and your risk tolerance it can be accepted by few and some prefer not to go near such a trading system.
How to recover from a drawdown?
Drawdown is obviously that traders prefer not to talk about. But as with most things, you can manage a drawdown. The key is to focus on keeping your emotions in check.
After all, no one likes to lose money. And when you lose money your emotions take control of you. This can lead to making bad trading decisions and will lead to a point when your account is at risk of a margin call.
The first thing to do after you hit a drawdown is to take a break. Then come back and reassess what went wrong. Try to figure out the reasons and actions why you took the losses.
A drawdown is a great time to analyze your trading system and find out what went wrong.
Another factor to focus upon when you want to recover from a drawdown is your bias. Sometimes, the mind can trick you into believing that you are right. Remember that the markets are always right.
Holding on to a losing trade in hopes that it will turn around is a big risk that you should control.
Position or risk management is very crucial when it comes to trading. This is even more important because it will affect your drawdown as well. When you are wrong, accept your defeat and cut your losses short.
When you are right, try to capitalize on the gains as much as you can. At the same time lock in profits regularly.
Most of the drawdown occurs because a trader just leaves the trade open without locking in the profits. This exposes the trader to the wild swings in the markets.
And yes, perhaps you might have got the message by now, but a good way to keep your drawdown in check is to use to use a stop order frequently.
Drawdown – In conclusion
A drawdown is really nothing to fear about. Of course, you will have something to fear about if the drawdown wipes out your capital. A drawdown can make you a more disciplined as a trader, something which we all need.
A drawdown can occur in any market and affects all asset classes. There is just no way to escape from a drawdown. A drawdown can be used to assess the weakness of your trading system and it helps to become a better trader.
Drawdown is an important metric and it affects not just you as a trader but also as someone who wants to invest. You can use the drawdown factor when assessing mutual funds or pension funds or even an ETF. It will give you a rough estimate of the volatility and can tell you if you can accept the volatility of the fund.
Many traders often give up after hitting their first drawdown. But it all depends on how you assess the situation. You can to either stop trading or use the drawdown as an opportunity to better yourself as a trader.


 Day Trading Basics


