Have you ever wondered why a stock will continue higher, even though the indicators are all rolling over? Well, this my friend is what we call divergence in stock trading.
In this article, we will cover three indicators and a real-life example for how to trade the setup.
Divergence in stock trading is the contradiction between price action and indicators on the chart.
Since indicators themselves are based on price action, if the price is going contrary to the indicator, this is a clear sign that trouble is on the horizon.
This conflict of price and technical indicators is one of the strongest signals in trading.
The strength in the signal is related to the fact that a potential trend reversal is on the horizon. From experience, you can make the most money if you are able to catch a trend at the very beginning.
Types of Divergence in Trading
There are two types of divergence on the chart – bullish and bearish.
Bullish Divergence
A bullish divergence in stock trading is created when the price action is moving lower on the chart, while your indicator of choice is creating higher lows.
If you see this setting up on the chart, a trader should begin looking for opportunities to get long.
Bearish Divergence
A bearish divergence in stock trading is created when the price action is moving higher, while your indicator of choice is making lower highs.
If you seeing this sort of discrepancy on the chart, you should begin looking for opportunities to open a short position.
3 Indicators you can use to Identify Divergence Signals
Now, we will walk through three different indicators you can use to trade the setup. Each one will have their own sets of strengths and weaknesses.
It will be up to you to determine which method works best for your trading style.
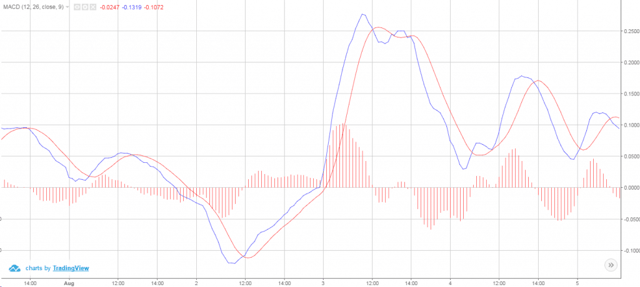
1) MACD Indicator
The moving average convergence divergence consists of a faster and a slower line which are constantly interacting with each other and the zero line.
The most common trigger when using the MACD is when the fast line crosses through the slow line. If the cross is up, then you have a bullish signal. If the fast line crosses below, then you have a bearish signal.
Pretty simple if you ask me.
Now one additional point to make is that the bigger the distance between the two lines, the stronger the signal.
Divergence
When it comes to price discrepancies, the MACD will provide a bearish signal if the price action is increasing and the MACD lines are decreasing.
Conversely, if the price goes down and the MACD is trending higher, you have a bullish MACD divergence.
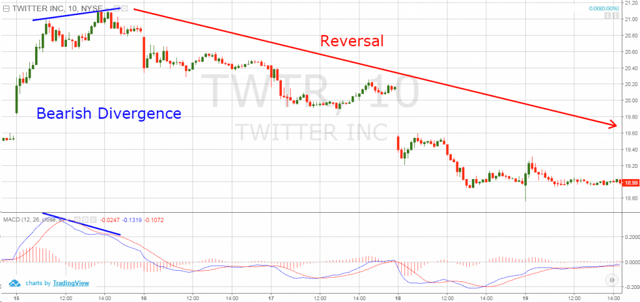
MACD Bearish Divergence
This chart illustrates a bearish MACD divergence. See that in the beginning of the chart, the price creates higher highs, while the MACD is decreasing.
This creates the bearish divergence on the chart. As you see, this signal is a precursor for the start of a new bearish trend.
2) RSI Indicator
RSI is the abbreviation for the relative strength index. The indicator is considered part of the oscillator family and is comprised of a line which fluctuates in three areas.
These three areas are the oversold zone below 30, the overbought zone above 70, and a neutral zone between 30 and 70.
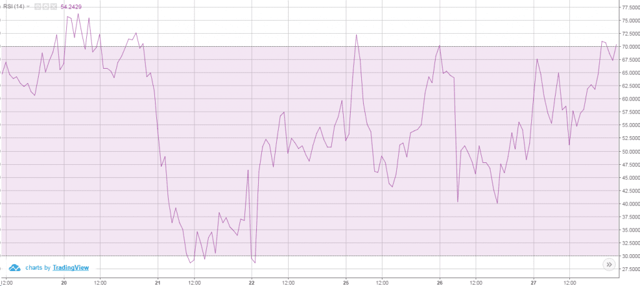
RSI
The RSI gives a sell signal, when the line goes in the overbought zone above 70. Conversely, we receive a buy signal when the line goes in the oversold zone below 30.
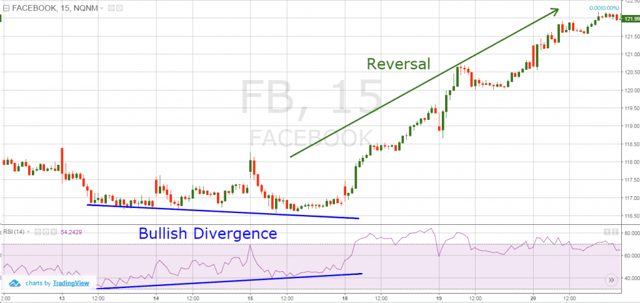
RSI Bullish Divergence
This chart shows a bullish divergence with the RSI.
See that the price action creates lower bottoms on the chart. At the same time, the RSI sets higher bottoms in the indicator area. This creates a strong bullish divergence on the chart.
Once this discrepancy resolves itself, the price begins a strong bullish trend higher.
3) Stochastic Indicator
The stochastic is another tool from the oscillator family.
Similar to the RSI, the two stochastic lines fluctuate in three areas located in a 0-100 zone. These are the oversold area between 0 and 20, the overbought area between 80 and 100 and the neutral zone between 20 and 80.
The main signals of the stochastic oscillator (SO) are the overbought and the oversold signals. We receive a sell signal when the lines enter the overbought area between 80 and 100. Opposite to this, we receive a buy signal when the lines enter the oversold area between 0 and 20.
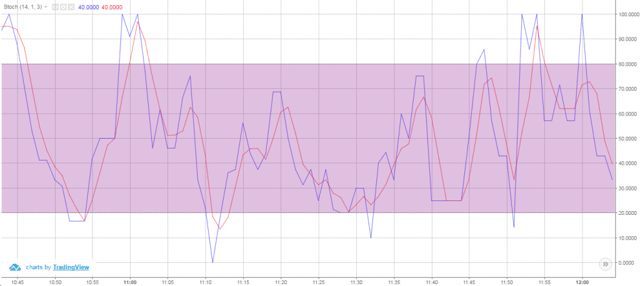
Stochastic Oscillator
The pink area is the neutral zone. The upper and the lower white areas are the overbought and the oversold zones respectively.
The stochastic divergence works the same way as the other two tools we discussed. The signal comes when the direction of the price action and the direction of the SO are different.
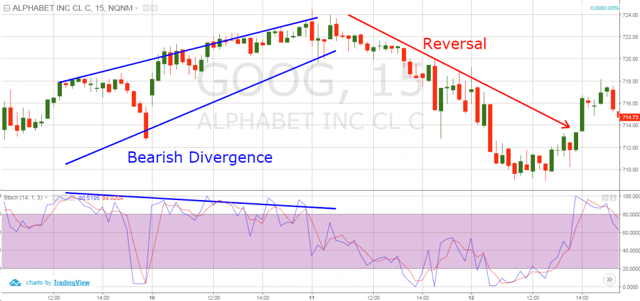
Stochastic Divergence
Above you see a chart and the stochastic attached to the bottom of the chart.
See that the price action is increasing while the stochastic tops are decreasing. This creates a bearish divergence on the chart.
As a result of this discrepancy, the price action reverses and enters a bearish trend.
Divergence Trading Strategy
Now that you are familiar with the concept of divergence in stock trading, we will now discuss a day trading strategy you can use to profit from this setup.
Trade Entry
When you spot a disparity on the chart, you shouldn’t just hop blindly into your trade. You should first wait for price action to confirm the divergence signal.
This usually happens when the price breaks its trend line, signalizing a reversal. Another entry signal is when price breaks through support or resistance.
Once you receive either of these signals, you should use this an opportunity to initiate the trade.
Stop Loss
You don’t want to be surprised by an unexpected move against your trade, right? You can do this by using a simple stop loss order.
The right place for your stop loss order is above/below the top/bottom created by the reversal.
In theory, if you were able to catch the new trend as it is starting out, the previous swing point should not be breached.
Still think you can go without a stop loss? Well, have a look at this article by Drasko Kovrlija, where he highlights why traders should be careful using market divergence signals.
Profit Target
The first profit target method you can use is to draw trend lines on the chart. As long as the stock honors the trend line, you should stay in the trade.
Another method you can use is to look for when a stock begins to make lower highs or higher lows.
This is an indication that you may have a new divergence developing, which is in the opposite direction of your position.
As you can see, it’s not so much about getting the quick buck, but more about initiating a trade at the start of a new trend and then riding it for all its worth.
Divergence – Trading Example

Divergence – Trading Example
You are now looking at the 10-minute chart of Netflix from Aug 16-23, 2016. The image illustrates the way we trade a bearish divergence. It is created by the price action and the MACD indicator.
The image starts with a price increase, which is marked with a green bullish channel. At the same time, we notice that the MACD indicator is creating lower highs on the chart. Thus, we confirm the presence of the bearish MACD divergence.
We cannot enter a trade just because we have a bearish divergence on the chart. We need confirmation of the reversal and we wait on the price action to give us that signal.
Suddenly, the price action breaks the lower level of the green bullish corridor. The break could be seen in the first red circle on the chart. We use this breakout to short NFLX.
At the same time, we place a stop loss order above the top created before the reversal. The stop is marked by the red horizontal line on the chart.
Netflix quickly enters a downtrend, which we have marked with the pink downtrend line.
The black arrows show the moments when the price tests the trend line as resistance.
Suddenly, the price action breaks the pink bearish trend line with the opening bell on Aug 23, 2016. This is a strong price action signal that the trend might change direction. Therefore, we close our short trade.
Conclusion
- Divergence is created when the price action contradicts with the movement of an indicator.
- Divergence in stock trading is a powerful reversal signal, as it can identify the start of a new trend.
- There are two types of divergence in stock trading:
- Bullish Divergence – created when the price action is bearish and the indicator creates higher lows.
- Bearish Divergence – created when the price action is bullish and the indicator creates lower highs.
- Three of the most powerful tools to identify divergence are the following:
- MACD Indicator
- RSI Indicator
- Stochastic Oscillator
- A good system for day trading Divergence is:
- Enter a trade when you see a discrepancy, confirmed by a broken trend line, support/resistance or a reversal chart pattern.
- Place a stop loss above/below the top/bottom formed in the time of the reversal.
- Stay in the trade until you receive an opposite signal from the price action on the chart.


 Day Trading Indicators


