A breakout of a range presents an opportunity to get long or short. But how do you know when the range has enough “juice” to generate a trending move. As day traders you will have a slew of data to analyze in a short amount of time. So, why not take the simple approach and instead of looking at ranges that go back 5 or 10 days, simply focus in on the most recent high and low trading range from the previous day.
When you think about it, every stock has its own trading fingerprint. This is because there are different market operators trading in stocks throughout the day.
But if you peel back the onion, you will notice that the bulls and bears begin to establish clear boundaries of how far they are willing to let a stock go in either direction. Your job is to simply monitor these ranges and then buy or sell short when the range is exploited.
Requirements for the Previous Day Range Breakout Strategy
- Identify the price range of the previous day (High – Low)
- Look back 2 days to see if the range for the previous day deviates greatly from the range set 2 days ago. You want to avoid a situation where the ranges are completely erratic and a break of the range means little.
- Buy or sell short the stock once the current day’s range breakout exceeds the previous day’s range by 10%.
- Use a simple moving average to stop yourself out of the trade. Logic here is you are buying or shorting the start of a new impulse trend, so you want to go along for the ride. Another strategy would be to sell the stock out as you approach a predetermined price target.
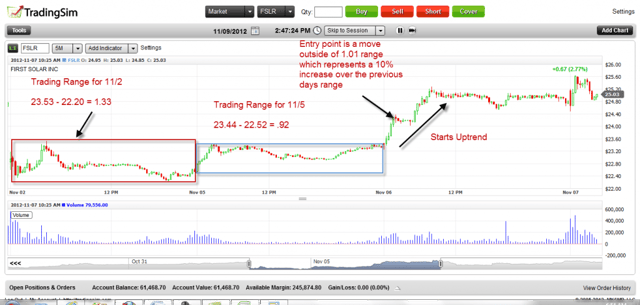
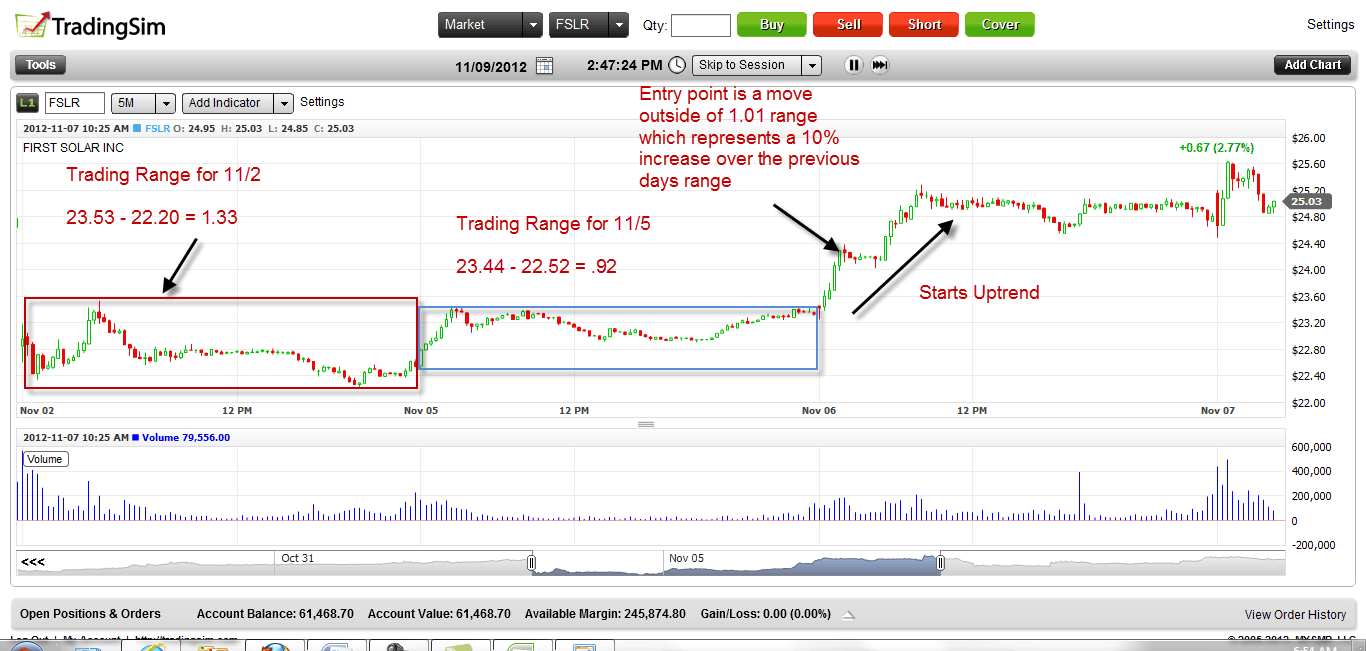
In this first example, we will review First Solar (FSLR). The previous day’s range on 11/5 was .92 cents. In order to make sure we are not going to get head faked, we went back one additional trading day to 11/2 and noticed the trading range was $1.33.
With the stock trading currently in the $20 dollar range, the delta between the ranges does not give a reason for concern.
Now turning our attention back to the current trading action of 11/6, the stock set a low of $23.25 on the first 5-minute bar and then quickly began to rally. So, we now would need to set our target entry point for the stock.
Since the previous day’s range was .92 cents we will want to buy or sell short a breakout above a range box of $1.01 (.92 cents x 1.10%). Based on the low set at $23.25 we would look to enter the trade on a break of $24.26 ($23.25 + $1.01).
As you can see from the above chart once FSLR broke through $24.26 the stock took a quick breather and then resumed her uptrend until reaching a high of $25.28 or nearly a dollar of profit.
Can you recognize what in this trade would have given you confirmation that the breakout was real?
Well if you don’t see it, take a look at the volume indicator near the bottom of the chart. Notice how the stock began to have an increase in volume as the price moved higher. This was a clear sign that the buyers were pushing FSLR higher and the stock had legs.
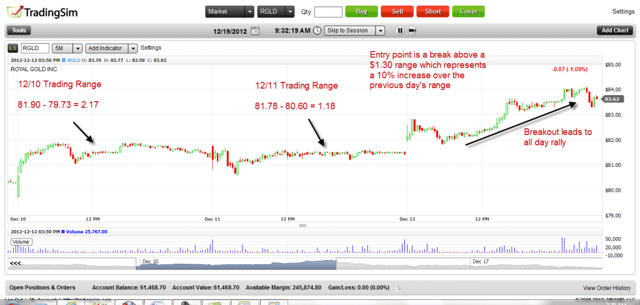
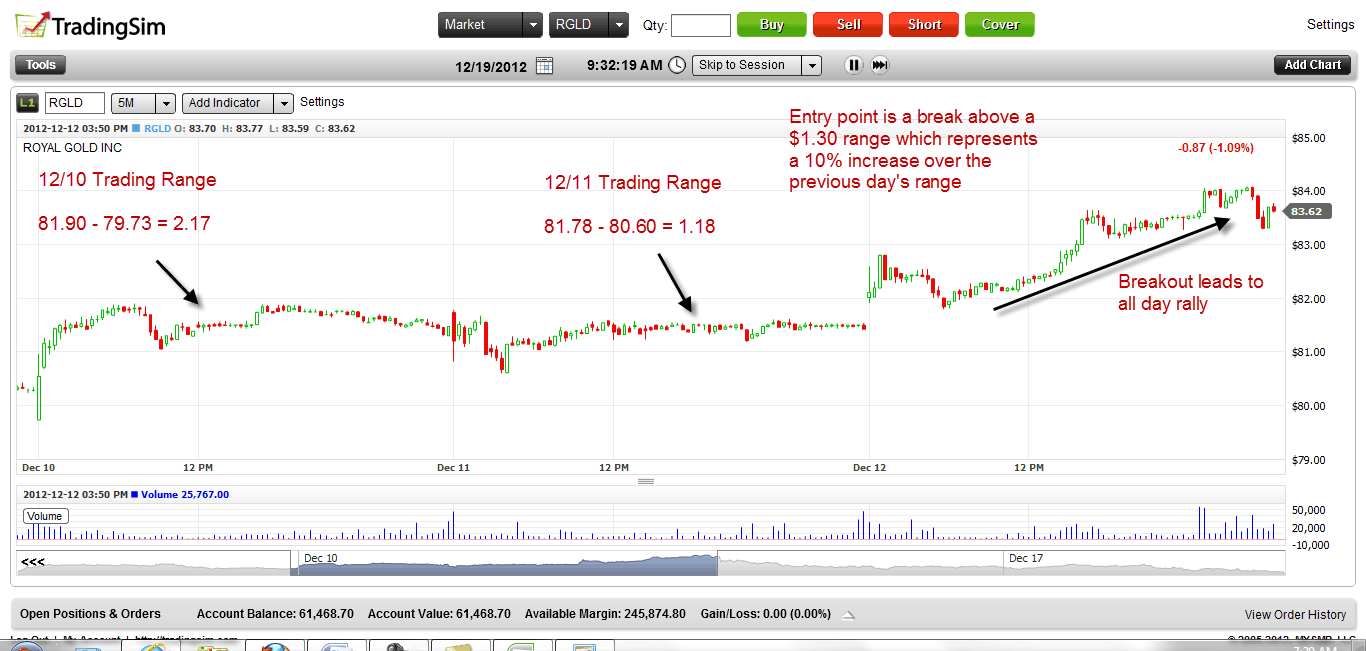
In the next example, we will analyze Royal Gold (RGLD). The stock set a trading range of $1.18 on 12/11.
Just as a sanity check we went back an extra day to 12/10 to validate the range is not exponentially larger. While the 12/10 range was greater, it is not a matter of concern with the stock trading in the 80s.
So now that we know our previous day’s range was $1.18 we apply our 10% lift for a target of $1.30. This basically means that if the stock’s price moves above or below an intraday range of $1.30 we want to open a position.
RGLD starts out the 12/12 trading day with a gap up only to see the stock reverse lower. Now at this point, you do not know if you are going to go long or short the stock. RGLD then stops dead in her tracks around 11 am, which is a common reversal time and begins to move higher.
Now that we have an established low from the morning of $81.79 you will want to place your buy limit order above $83.09. This is also a great entry price because it places your order behind the whole number of $83.
As RGLD approached and sliced through the $83.09 level you will notice that the volume picked up on the chart. Remember this was our extra piece of confirmation from our previous example with FSLR.
Another promising point with the volume is the increase came during the middle of the day which is normally a pretty dead time in the market. This implies that the stock had real potential and would likely move higher throughout the remainder of the day.
RGLD began to flag after the breakout above our entry point and then had another late-day surge up to $84. Depending on your strategy you could have exited at the next dollar level of $84 or stayed long through the remainder of the day until your moving average of choice was violated.
Pros of Day Trading a Previous Day Range Breakout Strategy
- The previous day range breakout strategy takes into account volatility which I think so many day traders simply ignore. If a stock has a trading range of $2, why would you enter a trade with an expectation of a $10 dollar move?
- The entry levels are somewhat hidden. Unlike other strategies where you buy the break of the previous day’s high, this strategy is based on the box ranges and less about obvious high or low price points. It also helps that it requires you to wait for a move slightly beyond the previous day’s range to give you confirmation.
Cons of Day Trading a Previous Day Range Breakout Strategy
- With day trading, every cent counts towards your bottom line. Waiting for the confirmation may prove a conservative approach against potential head fakes, but if you are consistently right on your picks, over a few hundred trades these forfeited insurance points could add up to big money.


 Volume Indicators


