Gann Square of Nine – How to Trade Using This Forecasting Tool [Updated July 2026]
Jul 21, 2026
Written by: Al Hill
✓ Reviewed by Kunal Vakil, Co-Founder of TradingSim · Updated Jul 22, 2026
Key Takeaways
The Gann Square of 9 is a spiral of numbers W.D. Gann used to forecast support, resistance, and time cycles by relating price to geometric angles.
Key levels appear at 45, 90, 180, and 360-degree rotations around the square, which often act as intraday turning points.
The tool works best when confirmed with price action and volume rather than used in isolation.
A Gann Square of 9 calculator removes the manual math so you can focus on execution.
Practice Gann setups risk-free on the TradingSim replay simulator before trading real capital.
Considered one of the “titans of technical analysis,” Gann and his Gann Square have gone down in trading history with the likes of Dow, Wyckoff, and others. In this post, we’ll give you a brief introduction to Gann and why his techniques are important.
Gann
Who is W.D. Gann?
The trading concepts used by William Delbert Gann, or W.D. Gann as he is fondly called, bring feelings of intrigue and mystique.
He is primarily known for his market forecasting abilities, such as the Gann square of nine which combine a mix of geometry, astrology, and ancient math techniques. Gann started trading at the age of 24 and was a religious man.
Gann was also a 33rd degree Freemason [1], to which some attribute his knowledge of mathematics and ratios.
For the most part, Gann’s works have been open to interpretation. Therefore, to trade based on Gann’s methods requires extensive practice and understanding.
Understanding Gann
Unlike trading with technical indicators where you can buy or sell when certain variables are met, trading with Gann’s methods is not as straightforward. This is because learning the methods takes time. You can’t just apply a few moving averages to the chart and give it a go.
The other challenge is that there are few clear Gann trading strategy experts to learn from. The only one we are really aware of who offers a public service is Jeff Cooper from T3Live.com. You can find Jeff on Twitter at @JeffCooperLive. He offers his own instruction on the Gann Square.
Among the many trading methods known to Gann, the square of nine is quite popular.
What is the Gann Square?
Squares, circles, and triangles are the three most common geometric shapes that form the basis for most of Gann’s work.
Gann’s wheels and squares are some of the most common applications and form the cornerstone of Gann’s work.
For example, Square of nine, Square of 144 and the Hexagon are some of the many works from Gann that are popular.
How to construct the Gann square
Square of Nine
The square of nine or Gann Square is a method which squares price and time. The Gann square of nine gets its name because if you look at the above chart again, the number 9 represents the completion of the first square.
The square of 9 is a spiral of numbers with an initial value “1” starting at the center. Starting from this value, the number increases as we move in a spiral form and clockwise direction. According to experts, each cell in Gann’s square of nine represents a point of vibration.
How to Calculate the Square of Nine
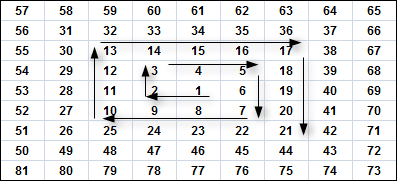
The numbers within the Gann square of nine also follow a certain harmonic pattern. For example, when you take a number, such as 54 from the above square, the value to the next of it (to the right), 29, is derived as follows:
The square root of the number and subtract 2, and re-square the result.
Ex: 54 is the original number
The square root of 54 = 7.348469
7.348469-2 = 5.438469
(5.438469)2 = 29 rounded off
To determine the value to the left, instead of subtracting 2, the number is added. So, we simply add +2 to the square root of 54 (7.348469), bringing the value to 9.348469. We then square this result to get a value of 87.
How does the Gann Square work?
The Gann square of nine helps to identify time and price alignments in order to forecast prices.
In the Gann Square of nine, the key numbers of importance are as follows:
0 or 360 degrees: 2, 11, 28, 53….
45 degrees: 3, 13, 31, 57, 91…
90 degrees: 4, 15, 34, 61, 96…
180 degrees: 6, 19, 40, 69…
Cardinal Cross and Ordinal Cross
The next sets of important numbers fall within the cardinal cross and the ordinal cross.
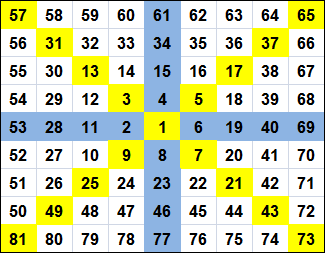
The picture below shows the cardinal cross, represented in the blue horizontal and vertical lines. The ordinal cross numbers are represented in the yellow cells.
The numbers that fall in the cells represented by the cardinal and ordinal cross are key support and resistance levels.
While both are important, the ordinal crosses are of less significance and can be breached at times.
Gann Square – Cardinal and Ordinal Cross
The most important numbers as we know it occurs every 45 degrees on the nine chart.
Each degree is a representation of time.
Above is a standard 1×1 chart. As an example, if price made a high of 54 on the day, if price retreats, the next support is 29, as it is the next closest number across the square of nine.
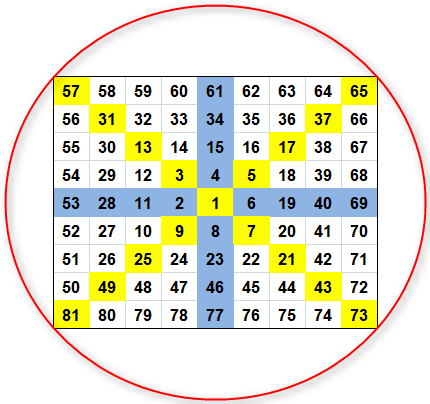
Circle Around the Square
Also, drawing a circle connecting the four corners of the squares brings the concept of angles into perspective. The angles, measured by degrees can point to potential support and resistance levels when the price is said to be moving within an angle.
The chart below shows the Gann square of nine with the circle plotted around it.
Gann Square of nine with the circle, introducing angles and degrees
Using the Gann Square
To use the Gann chart, simply replace the starting number 1 with a number of your choice and the desired step value. In the above example, the increment is 1, but you could use larger or smaller values.
Based on this information, traders can look to either buy or sell into the nearest support or resistance level.
Gann’s square of nine also factors in planetary movements and the degree of price movement based on the circle.
There is a big difference between forecasting prices and trading. For example, one can forecast that the Emini S&P500 will rise to 2100 within a certain period of time. What the forecasting won’t tell you is whether the move to 2100 will be straight, or if the price will fall by a significant number of points before rising to 2100 and so on.
These might seem insignificant when it comes to forecasting, but they can be the very things that can define a successful or a bad trade.
Additional Resources
To go deeper on Gann trading strategy, check out this awesome interview covering Gann and swing trading. The video is close to an hour and provides additional insights you can use to help develop a Gann trading plan.[2]
Lastly, if you are looking for original Gann teachings, please visit https://www.wdgann.com/. This is the site for WD Gann, Inc. which according to their site, purchased the original Gann writings from his business partner Ed Lambert in the 1970s. [3]
The Gann Square of 9 is a spiral grid of numbers, starting at 1 in the center and rotating outward, that W.D. Gann used to forecast price support and resistance. Traders relate the current price to angles on the square (45, 90, 180, and 360 degrees) to project where a stock or futures contract may reverse.
How do you calculate Gann Square of 9 levels?
Take the square root of the current price, add or subtract a rotation factor (for example 0.125 for 45 degrees or 0.25 for 90 degrees), then square the result. The output is the projected support or resistance level. Most traders use a Gann Square of 9 calculator to automate this.
Is the Gann Square of 9 reliable for day trading?
It can highlight useful intraday levels, but no forecasting tool is reliable on its own. Combine the Square of 9 with confirmation from price action, volume, and market structure before entering a trade.
What time frames work best with Gann analysis?
Day traders typically apply the Square of 9 to 1-minute, 5-minute, and 15-minute charts for intraday levels, while swing traders use daily charts. The method scales to any time frame.
Can I practice Gann Square of 9 setups without risking money?
Yes. The TradingSim market replay simulator lets you test Gann levels against real historical stock and futures data so you can validate the approach before committing real capital.
Alton Hill is the Co-Founder of TradingSim with over 18 years of trading experience. He completed the Design Thinking Bootcamp at Stanford’s D.School and brings expertise in Product Development to create the best trading simulation experience. His strategy focuses on trend-following systems, targeting high-volatility stocks with strong primary trends using the 15-minute chart.
3 Trading Indicators to Combine with the Klinger Oscillator
What is the Klinger Volume Oscillator? The Klinger Volume Oscillator (KVO or KO) is a volume-based indicator, which assists traders to identify a longer-term view of price trends. Since the KVO is a...
Automated Day Trading Definition Automated Day Trading Definition Automated day trading is probably one of the most interesting aspects of day trading. It often brings awe and mystery to it. This is...
Projection Oscillator Definition The projection oscillator was developed by Dr. Mel Widner and is intended as a modification of the projection bands. The thing that makes the projection oscillator...


 Day Trading Indicators


