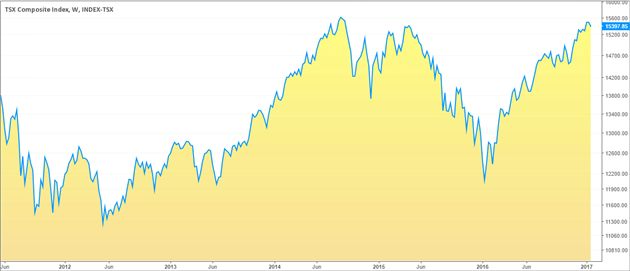
The Toronto Composite index or TSX for short is also known as the S&P/TSX composite index. It is a benchmark for the performance of the equity markets in Canada. A composite index is a group of equities clubbed together to provide statistical measure of the market performance over time.
The composite index (S&P/TSX) is used to track the overall price changes in the equity markets in Canada among a select list of companies and is therefore used as a benchmark for the overall performance of the stock market and for individual equity portfolios as well.
Typically, the goal of an equity portfolio or a hedge fund is to outperform the main composite index such as the S&P/TSX index. Although the composite index doesn’t cover the entire market, the selection criteria play a big role. It is often used as measure of the overall equity market performance of the economy or the country where the stock index is based.
Toronto Stock Exchange (TSX) Index
Because Canada and the U.S. are two major advanced economies and the fact that they are next to each other makes both the nations close trading partners. As a result, the monetary and fiscal policies as well as the strength and the weakness of one economy are often felt in the other. It is almost the same story when comparing the TSX and the S&P500, which are the two major benchmark stock indexes for Canada and the U.S. There are many different versions of both the TSX and the S&P500. For example you can trade the ETF versions, as well as the futures derivatives versions of the same product. Regardless of what type of market, all the versions of the TSX and the S&P500 track the price of the underlying cash market.
The S&P/TSX stock index is a float adjusted market capitalization index. A company that is listed on the TSX index has a float adjusted market capitalization which is calculated by removing the control blocks of 10% or more. In comparison, the S&P500 is a market capitalized stock index. In both the indexes, the criterion to add or exclude a stock listing depends at the sole discretion of Standard and Poors.
Overview of the TSX Composite Index
Stock trading in Canada dates back to the 1950’s when the Toronto Stock Exchange was created in 1952. At the origin, only 18 stocks were traded on the exchange and by 1977, things began to change with the advent of Computer Assisted Trading System (CATS). In fact the Toronto Stock Exchange was the first to introduce computer assisted trading besides introducing the decimal system for the stock index at a time when fractional pricing was used across other major exchanges in the world.
The TSX (Toronto Stock Exchange) covers ten business sectors in Canada which are: Utilities, telecommunications, materials, IT, industrials, healthcare, financials, energy, consumer staples and consumer discretionary.
The S&P/TSX originally comprised of about 300 top Canadian stocks but the number of stocks in the index varied over the years. The TSX Index originally started out as TSE300 and had 300 companies listed in the stock index with a yearly review where the listings could be changed. This was back in 1977.
By 2002, the TSX composite index was contracted to the Standard and Poors in the US which eventually saw the TSE300 being closed and gave rise to the S&P/TSX Composite index on May 1st 2002. The changes also saw the index’s structure and other aspects being overhauled as well, including the construction of the index and the management. New rules were introduced for stocks to be included in the S&P/TSX index and number of the stock market sectors were brought down to the ten sectors listed earlier from the previous 14.
As the picture shows below, financials have the highest weightage on the TSX stock index followed by energy, where Crude oil forms an integral part which is a key export product for the Canadian economy.
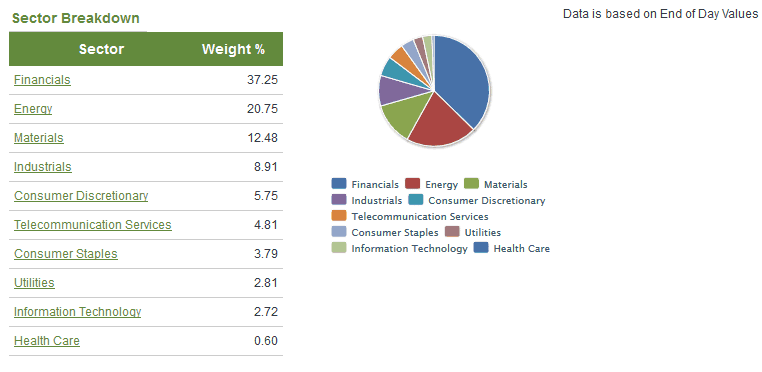
TSX Futures – Sector Breakdown (Source – TMXMoney.com)
Unlike the TSE300 which was reviewed once a year, the new S&P/TSX index was reviewed every quarter and at the discretion of Standard and Poors. The index can be adjusted at any of the quarterly reviews with the consent of the seven members making up the S&P/TSX index committee. One of the biggest factors that make the TSX unique over other global stock indexes was the fact that the number of companies in the stock index varied.
For example in one year, it could have contained 269 companies, while the next year, the number of companies could be dropped to just 204. For example in 2005 and 2011, the S&P/TSX excluded tech stocks which were not performing so well.
These erratic changes to the TSX stock index made it somewhat volatile and hard to track over the longer periods of time. The TSX Composite index now comprises of 249 companies. Some of the well known companies listed on the TSX include: Air Canada, Barrick Gold and Bank of Montreal to name a few.
TSX Futures Contracts
The SXF futures track the underlying cash market of the S&P/TSX60 stock index which represents the leading companies across the ten different sectors. The TSX Futures are only offered on the Montreal Exchange which is the primary futures trading exchange of the Canadian derivates markets. In comparison, the S&P500 futures are traded on the CME Group futures exchange.
The SXF futures come with a multiplier of C$ 200 times the S&P/TSX60 index futures contract value. Similar to other equity index futures, the SXF contracts come in quarterly expiring contracts, for March, June, September and December.
SXF futures prices are quoted in index points and expressed in up to two decimals. The minimum index point move is 0.10 point and the futures contracts are settled for cash. All SXF contracts are cleared by the Canadian derivatives clearing corporation. Besides the SXF, there are other versions of the TSX futures contracts including the emini versions of the contracts as well. A major distinction here is that the TSX futures track the TSX60 market and not the main stock index which tracks close to 300 companies.
The chart below shows the SXF futures price chart.
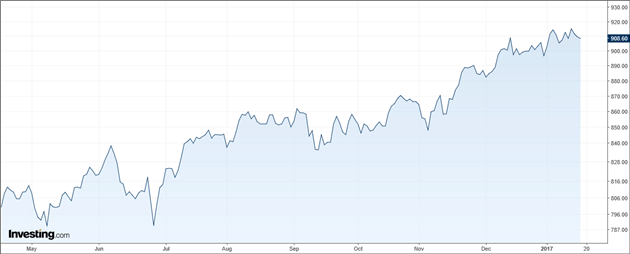
TSX Futures Price chart (SXF futures)
TSX Futures and the S&P500 Futures Correlation
When talking about the correlation between two stock indexes from two different economies, one way to look at it is to compare how the indexes performed during key economic events. For example, the stock market crash of 1929 did not have any significant impact on the Canadian markets and thus on the TSX. While on the contrary, in the U.S. over 2000 investment and brokerage firms went bust.
However, bear in mind that the TSX has undergone a lot of changes over the years. For example, the TSX used to have some level of correlation to the U.S. Dow Jones Index when the TSX was tracking over 300 companies at one point. The market crash of 1987 for example was different as the TSX also fell sharply following the trends exhibited in the U.S. counterparts such as the Dow Jones and the S&P500.
The TSX futures and theS&P500 futures contracts show a fairly high level of correlation. Because of the fact that both the stock indexes are one of the major benchmark indexes of the U.S. and Canada, the respective equity indexes tend to exhibit a certain level of similarity.
While it is difficult to determine the correlation between the futures markets, the ETF version of the TSX and the S&P500 shows that both these indexes have a correlation of 0.78 as shown in the picture below.
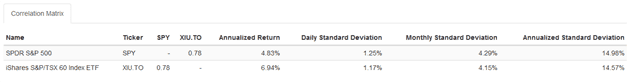
Correlation between TSX and S&P500 ETF’s (source – Portfoliovisualizer.com)
Although the ETF’s are different markets, the correlation between the S&P500 and the TSX60 ETF shows that a similar correlation exists in the futures markets as well. In terms of confidence, the data shows that there is a 90% confidence that both the markets move in the same direction. Generally a correlation of 1 or positive correlation indicates that two markets are nearly identical in their behavior and tend to exhibit the same characteristics such as prices moving at nearly the same rate. A correlation of around 0.90 indicates a near certain movement in both the assets, but not exactly on a 1:1 basis. Overall, a correlation of 0.80 and above is said to be very strong, while a correlation of 0.70 – 0.80 is said to be strong.
Therefore the correlation of 0.78, between the TSX and the S&P500 ETF markets suggests that there exists a similar level of correlation in the futures markets as well.
Besides the rather strong correlation, the TSX and the S&P500 markets are strongly interlinked due to the level of trade and interdependence between the two economies in question. While global factors that hit market sentiment such as political uncertainty in some region or other similar events tend to affect the global stock market indexes on the same level, other domestic factors that influence the index independently of each other exists.
The health of the U.S. economy also plays a big role in impacting the index performance for the TSX. For example a weaker economy would infer that the pace of exports from Canada will slow, likewise a healthy U.S. economy bodes well for Canada which translates to higher export volumes. Similarly, the U.S. dollar’s exchange rate is also an important factor in influencing the exports and imports, all of which tend to eventually affect the respective economy’s stock markets.
When comparing the TSX and the S&P500 stock index, it is important to also pay attention to the monetary policies from the Bank of Canada and the U.S. Federal Reserve. The BoC often lags behind the Federal Reserve, meaning that when the U.S. is in a rate hike cycle, you can expect to see Canada’s interest rates start to rise as well, and vice versa, lagging over a few quarters.
For example, the TSX also tends to closely follow the oil prices as well. Because Oil is a big export product from Canada, the index has lot of companies that have exposure to crude oil, which tends to affect the stock index on the whole.
The chart below shows the Crude oil prices and the TSX index compared together.
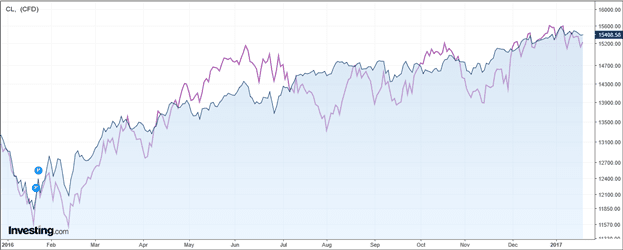
TSX and Crude Oil prices comparison
On the other hand, the impact of Crude oil prices on the S&P500 stock index is more limited as the stock index contains a wider set of industries than compared to the TSX index. Still with a correlation factor of 0.78, it is safe to suffice that the TSX and S&P500 futures markets are correlated. Although, having said that day traders should be looking at both the markets independently before taking up any traders with the correlation coming in only as a confirmation of the market bias.
When two assets are strongly correlated, it highlights the fact that traders who have exposure to both the markets are less diversified and therefore increases the risk to the downside. For traders, it is essential to understand how the markets interact under different market conditions. Correlations are never set in stone and tend to change over a period of time. Therefore, traders need to be aware of the current market drivers along with having an eye on the short term and the long term outlook off the markets in question.
One way to ascertain the level of correlation and the various periods is to watch how the markets react over a period of time which underlines the importance of paying attention to risk and diversification. A good example of this is the way the TSX had little impact during the 1929 crash, but the index also took a hit during the 1987 crash. This indicates that traders cannot afford to be complacent when comparing two different stock indexes. The correlation of 0.78 today could easily be higher or lower in a few months time and the major constant being the short term market drivers that can influence the correlation. It can come in different ways, from oil prices to inflation to monetary policy to an outperformance of an underperformance of a particular sector.


 Swing Trading Strategies


