Bear Market Rally Definition
Bear market rally, as the name suggests, is a rally or an upward move in prices. This is marked by the overall bear market. A rally is defined as a period where price of the asset increases steadily.
In the financial markets, a bear market is defined as one where price of the asset has fallen by 20% or more in a two-month period. What sets aside the bear market rally is that the price increase is only temporary.
Attempting to catch the start of a bear market rally is often risky. While at times this can work, leading to strong gains as prices are picked up at a discount, it can also be very risky.
In many cases, investors and even day traders will have no idea if the rally will sustain, which makes trading the bear market rally even more complex.
A bear market rally is usually witnessed in the main stock indices. However, it is also evident in individual stocks or assets as well. But comparing the two, there is a lot more documented evidence on the price behavior in an index rather than a stock.
The U.S. stock markets have witnessed it significant share of bear markets and thus, bear market rallies have been talked about and covered widely in the financial circles.
1 – Anatomy of a bear market rally
To understand how a bear market rally works, we need to first know what a bear market is. The terms (bull) and bear markets are used to describe the price behavior of the asset.
When prices are steadily rising, the market is said to be in a bull market. Conversely, when price of the asset is steadily falling, the market is said to be in a bear market.
A bull market is often met with optimism and positivity. It encourages more market participants to buy into the trend and this in itself pushes price higher. A bear market on the other hand is when
There are a number of ways one can objectively define a bear market.
In the first chart below we can see the bear market for the SPDR S&P500 ETF (SPY) between the periods of 2000 through 2003 where the markets hit a new low. During this period, there have been multiple instances of a bear market rally.
In each of the three instances, we can see how price rallied close to 20% every time within the broader bear market.
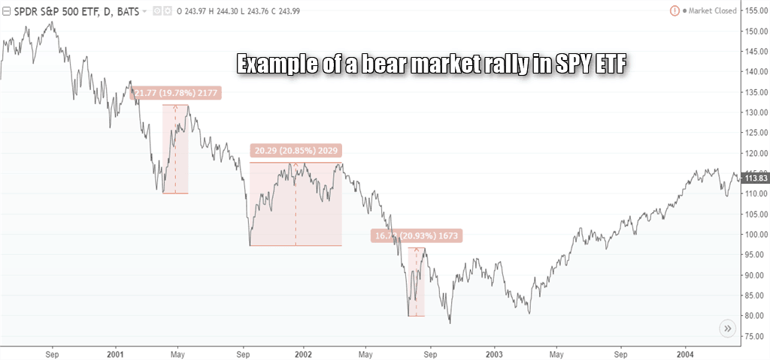
SPY ETF – Examples of bear market rallies in a downtrend
While it might have looked at that point in time about the rally in price, the price gain was unsustainable. Following the bear market rally, price then resumes the bearish trend and continues to post new lows.
An investor would have been mistaken to look at the rally and expect the bearish trend to be over.
2 – What is a bear market?
It is a market where the price of the asset is falling and is favorable to sellers. The bear market usually occurs amid widespread pessimism on the stocks or assets in question.
This negative sentiment becomes self-sustaining as more investors tend to join in and sell their holdings.
The question that often comes to mind is how to define a bear market trend. Interestingly, there is no definitive answer to this. However, there is a wide consensus that when price of an asset declines 20% or more for at least two months, then the market is said to be bearish.
According to some research done on this, the stock markets between the periods of 1926 through 2014 saw that the bear market, (as defined by a 20% decline over a two-month period) lasted 1.3 years. During this period, markets lost close to 41% of its value.
3 – How to Identify a Bear Market Rally
As mentioned, while there is no definitive answer, investors take into consideration several factors to determine a bear market. Below is a summary of the most commonly used techniques.
- The market should sell off by nearly 20% from the high to the low before forming a short-term bottom. This should typically last for two-months or more
- Volume can increase 300% or more when the initial bottom is suspected
- Day traders will often look at candlestick patterns such as the doji or a hammer that can form near the bottom before the bear market rally starts
- The bear market rally is usually swift and moves quite rapidly
- A typical bear market rally will see a 20% – 35% rally off the bottom that is formed. Following this, the market stalls and starts to resume the bearish trend
The above points make it quite evident on the complexity involved with the bear market rally.
Day traders can also look to some telling clues to identify the bear market rally. For example, a bear market rally typically results in lower highs being formed. Once price stalls out, the previous temporary bottom is often breached.
Subsequent bear market rallies are met with lower highs in prices.
In the next bear market chart, we can see the lower highs and lower lows evident with the bear market.
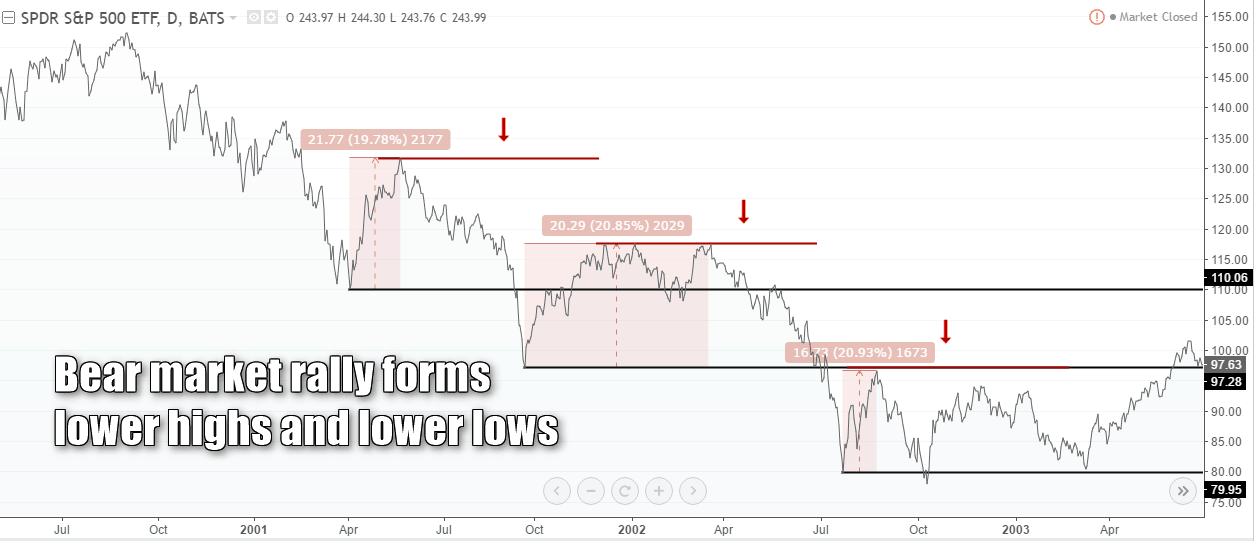
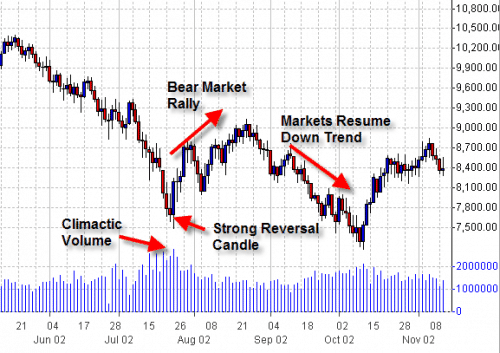
Bear market rally forming lower highs and lower lows
In the chart, we can notice that the bear market rally was rather sharp with little to no warning that a temporary bottom was being formed. Also, the reversal near the lower highs was also swift. Any investor or day trader thinking that a bottom was in place would have been sorely disappointed.
We also mentioned about volume surging when a temporary bottom is formed in the bear market, prior to the short-term rally. This is depicted in the next bear market chart where you can see how volume, compared to the previous sessions shoots higher.
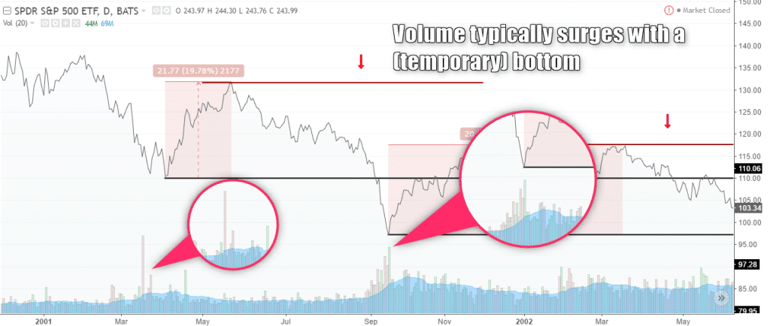
Volume increases near a temporary bottom and prior to the start of a bear market rally
Thus, volume can be a good indicator to inform market participants when prices are likely to push higher. However, this is by no means the sole indicator to rely upon. Sometimes, volume can surge despite price continuing to fall.
This is evident in the first instance in the above example of volume.
Volume surges rapidly prior to the first bottom that is formed. Then, as price rallies and slips back, the second bottom is met with lower volume. Still, comparing to the volume in the past sessions, it is evident how the combined volume near the double bottom that was posted signaled a short-term reversal in price.
4 – How to trade a bear market rally?
Trading the bear market rally is by no means simple. One might fall for the illusion that it is simple to trade, especially when analyzing the markets in hindsight. However, in real time as the markets unfold it can be tricky.
Trading a bear market rally is also risky because you are essentially going against the major market trend. Some call this counter trend trading. This is more suitable for day traders, but one needs to pick the right asset or security.
The average volume and liquidity can play a major role in determining one’s success. Factors such as the fill price can show strong deviation and when this is combined with spreads, it can lead to initial costs that need to be covered in order to break even at the very least.
Using ETF’s or looking to the derivatives markets such as futures can be one way to trade the corresponding asset synthetically.
Traders should also note that at times, the bear market can fall more than 20%, although the market could give the illusion that the wave of selling is done with. One needs to be especially careful here as there is no rule of thumb. Sometimes, price can fall as much as 20% and at times even 30%. It all depends on the market behavior and the broader market sentiment.
Having mentioned the risks of trading a bear market rally, here’s how one can plan to trade such markets.
The first step of course is to wait for the bear market itself. Day traders need to be sure that the market is indeed bearish.
Such opportunities do not occur very often, so waiting for a bear market to specifically trade the bear market rally will mean having to stay on the sidelines.
The following indicators or signals can help a trader to ascertain when it is a best time to enter the market.
- To begin with, look for a 20% – 30% decline in the stock market. However, this is by no means the only rule as some subjectivity is involved. The most important aspect that a trader needs is to be patient if they want to trade the bear market successfully.
- Once price of the security drops sharply, traders need to then look at signs of a bottom. Again, there is no telling when this can occur. Sometimes reversals take place during a single session and at times markets can turn flat before posting a bear market rally.
- Look for a new low to form and watch for price to show signs of any reversal. It is also important to pay attention to volume indicators as well when price is posting a new low.
- The volume should be above average, if not more and this is an essential aspect that will determine whether you are successful with trading the bear market rally or not
- Once you identify that price has formed a low and is seen bouncing off this level, validate it with an increase in volume. After these conditions are met, then look for a local pivot high to form.
- A local pivot high is different from a swing high. Most importantly, a local pivot high forms when price makes a significant short term high
- After identifying this high, wait for price to break past this high and then go long on the markets
- Profits can be booked at two times the risk, where the stop loss is placed usually at the swing low that is formed
- In most cases, it is best to manage at least two positions. The first position can be booked for profits for a fixed risk/reward ratio while the second position can trade at break even with trailing stops. The way a trader deals with this can be subjective and depends on the markets.
The next bear market chart below illustrates the above points when trading a bear market rally.
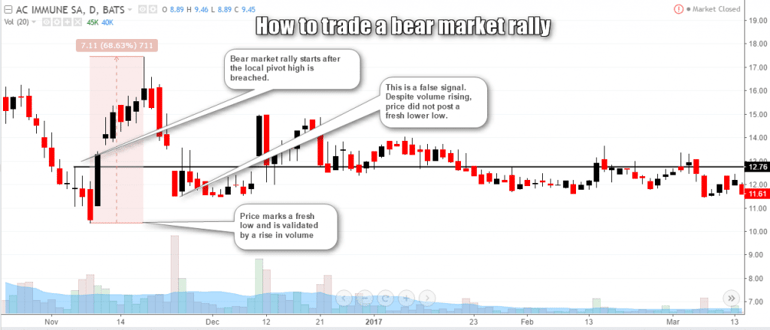
Example – How to trade a bear market rally
The following example is the price chart for AC Immune SA (NYSE: ACIU). The stock has been in bearish trend for the most of 2016. Around November 2016, we notice a new low being formed.
This low coincides with a surge in volume. You can see rising volumes for the prior three days. The horizontal line shows the local pivot high that was formed prior to this new low.
When price breaks past this local pivot high following the market bottom, a long position can be taken. This short-term bear market rally saw price rising by nearly 69% from the low.
You can also notice that here, the rally was less than a 1:2 risk reward, which goes to show that trading bear market rallies requires a lot of experience and subjectivity. Not all bear market rallies exhibit the same characteristics and this needs is something that should be remembered.
Following the rally in price, we can see that the stock starts to resume its declines, posting fresh lows after breaking past the initial flow that was formed.
In the above chart, you can also see that there are instances where subsequent sessions see an increased volume as well. While this might be tempting, the trade set up is invalidated for the simple reason that price did not post a fresh low.
As the above bear market example shows, trading a bear market rally can be quite rewarding, but the risks are equally high. Because the trend exhibited is counter to the broader market, price volatility is usually extreme. This means that you can expect sharp moves, leading to quick profits or quick losses.
Managing risk while trading a bear market rally is of utmost importance as winners can quickly turn to big losing trades.
To conclude, a bear market rally is not something that you see every day, at least in the broader markets. However, traders can look at individual stocks and pick out such trades. No matter what, pay attention to the stock or the security that is being traded, including the average volumes being traded on the stock.
Liquidity in the security plays a major role along with emotions. It can be easy to get drawn into a trade with the trader being married to their position. This can be disastrous as prices can turn volatile. Having a good eye on the markets and being objective with the ability to act quickly to changing market conditions can help to trade the bear market rally with success.


 Basics of Stock Trading


