The Aroon indicator was developed by Tushar Chande, who also created the Chande Momentum Oscillator indicator and the Qstick.
When it comes to day trading, strategies based on the Aroon indicator are some of the best you can apply to make quick profits in the markets. Aroon is one of the handful of technical indicators that can help you achieve consistent success with trend trading, as well as trading within a range. Learn how to use the Aroon indicator here.
If you have been day trading for a while, you have probably experienced that the price of a stock or security mostly stays within a range, where the price moves impulsively. The price trends up or down only a small percentage of the time during trading hours.
The Aroon indicator formula was developed in a way that it can anticipate when the price action of a security is changing from a range-bound state to a trending state so that you can establish a long or short position. It can also indicate when the price action of a security is likely to stop trending and start consolidating.
If you are trend trader, you can use the Aroon indicator to get into a trend early and get out when the trend is about to stop. Interestingly, if you like to trade within a range, you can also use Aroon indicator strategies to formulate a counter-trend trading system.
Aroon Indicator Formula

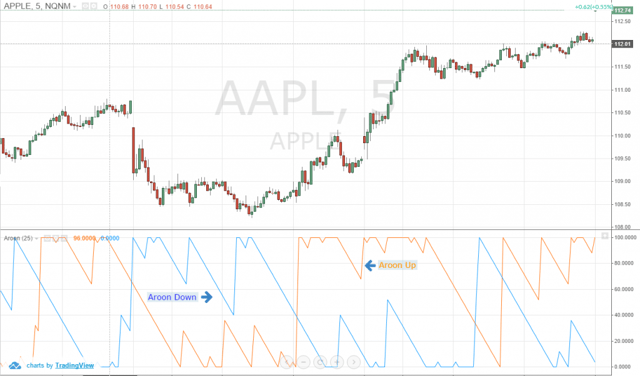
Figure 1: Aroon Up and Aroon Down Lines
The Aroon indicator was developed by calculating two Aroon lines on a chart that usually sits at the top or bottom of a price chart. The Aroon indicator is made up of two plots on the chart, 1) the Aroon Up and 2) Aroon Down.
The formula to calculate the Aroon Up line is: [(number of periods) – (number of periods since highest high)] / (number of periods)] x 100
Conversely, the formula to calculate the Aroon Down line is: [(number of periods) – (# of periods since lowest low)] / (number of periods)] x 100
While you can set the Aroon indicator to calculate any given number of periods, most day traders use the Aroon indicator with a standard 25-periods. We would recommend that you apply the Aroon indicator strategy with the standard 25-periods as well because it will help you stay “in sync” with the other traders in the market.
Interpreting the Aroon Indicator
As you can see in the chart above, the Aroon indicator oscillates between a maximum value of 100 and a minimum value of 0. Basically, you can analyze the relationship between Aroon Up and Aroon Down lines to interpret the price action of a stock in three different ways:
- When the momentum in the market changes from a bullish one to a bearish one, and vice-versa, the Aroon Up or Down will cross over each other and change sides.
- When the market is trending with strong momentum the Aroon indicator will display extreme readings.
- Lastly, when the market is consolidating, the Aroon Up and Aroon Down lines will stay parallel to each other.
Using Aroon Crossovers to Determine the Direction of the Trend

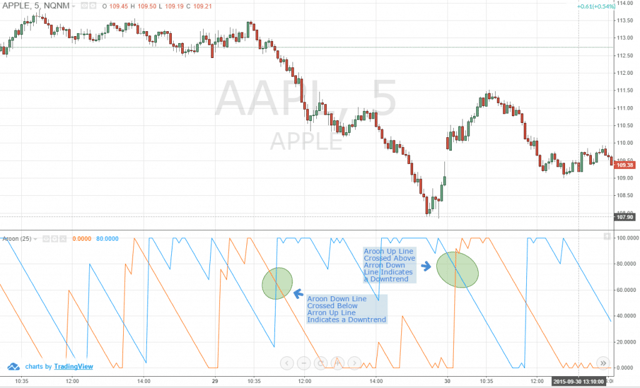
Figure 2: Aroon Up and Aroon Down Crossover
You can use the crossover of the Aroon Up and Aroon Down lines in order to easily determine the directional movement of price. When the Aroon Up crosses above the Aroon Down, it generates a signal that the price is about to start a potential bullish move. By contrast, when the Aroon Down crosses below the Aroon Up line, it indicates a potential bearish move.
However, you should not place a buy or sell order whenever there is a new crossover, because this is an indication that the existing trend has changed. Instead, you should wait for the price of the security to breakout of a range or trend line before opening a new position in the direction that the Aroon suggested.
Interpreting Aroon Indicator with Extreme Readings
Like most oscillators, you can interpret the Aroon indicator readings based on where the Aroon lines are on the chart compared to the value of the corresponding levels it represents.
The key levels you need to watch on the Aroon indicator are 80 and 20. Would you like to know how to tell if the price is trending up? You just have to wait for the Aroon Up line to move above the level 80. If you find the Aroon Down line is saying below Level 20 at the same time, it would confirm the bullish trend in the market. If you find the Aroon indicator in this situation, you should definitely look to place a buy order based on your trading system rules.
In contrast, if you are about to place a short order with the stock because you think the price has broken an important support level, you can use the Aroon indicator strategy to confirm the bearish momentum in the market as well. As you can imagine by now, in order to confirm a bearish trend, the Aroon Down line needs to be below the level 20, and the Aroon Up line should go the opposite way, above level 80.

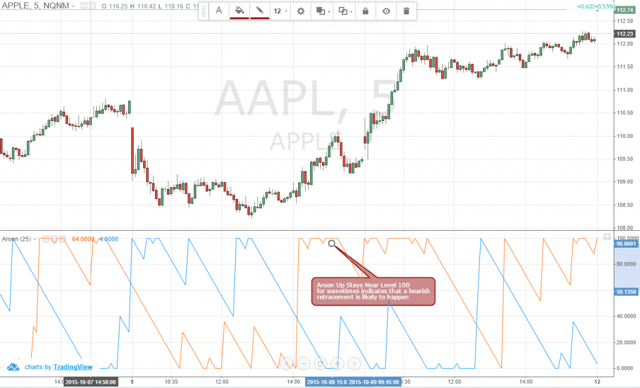
Figure 3: Aroon Up Showing Extreme Reading (100)
However, when you find that the Aroon Up or Aroon Down lines have reached level 100, you should always keep an eye on the market and try to protect your profits by moving the stop loss closer to the price. This is because the Aroon lines at level 100 indicate that the market has been trending for too long and might be overbought or oversold, and the price may start a counter move very soon.
In a strong trend, you should not get out of the market altogether, because any small correction in price would actually offer you another opportunity to add to your position.
For example, if the Aroon Up touches the level 100 then falls to level 90, but it is still above the Aroon Down line, you are in for a treat! It indicates a retracement in the market, and you should add to your long position instead of getting out of the market. Of course, during a downturn you should do the opposite and try to add to your short position.
Interpreting Aroon Indicator with Parallel Up and Down Lines

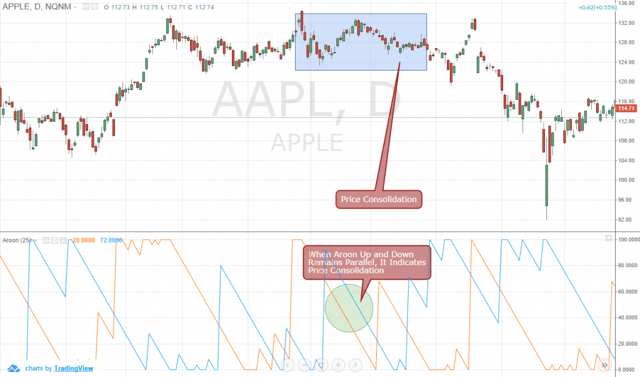
Figure 4: Aroon Up and Down Lines are Parallel to Each Other Indicates Price Consolidation
The interesting aspects of using the Aroon indicator strategy in day trading is that you can also use it during range-bound markets. When the price of a security consolidates within a range, the Aroon Up and Aroon Down lines will stay parallel to each other.
If you are a range trader, who likes to short the market near the top of the range and go long near the bottom of the range, the Aroon indicator can help you identify price consolidation zones and take advantage of your range trading strategy.
You know what? We will tell you a little secret. If you find the Aroon Up and Aroon Down lines to be parallel, it actually indicates that there is likely to be a breakout soon.
So, you should always pay extra attention to price action near the top and bottom of the range when the Aroon lines are parallel, as it can break out any time and start to gain momentum in either direction. So, be careful.
Aroon Oscillator
Besides the Aroon indicator, many technical charting packages also offer an additional tool called the Aroon Oscillator. If you deduct the value of Aroon-Up and Aroon-Down, you will end up getting the Aroon Oscillator value.
For example, if the Aroon Up value is currently 100, and Aroon Down value is 25, the Aroon Oscillator value would be (100 – 25) 75. You would often find the Aroon Oscillator plotted below the Aroon Indicator using a separate histogram in order to show the strength of the trend in question.
Aroon Indicator vs ADX
If you have been trading for some time, you can easily figure out that the Aroon indicator behaves almost exactly the same way as the Average Directional Index (ADX) indicator. However, you should remember that there are key differences between these two indicators.
If you analyze the formula of these two indicators, you would find out that the Aroon indicator uses only one major parameter, the time periods. The Aroon Up and Aroon Down lines are the amount percentage of time between the start of a time period and the point where the highest and lowest price during that period reached, respectively. In English, it means the Aroon Up and Down lines can indicate the trend strength and the direction of the trend.
On the other hand, the ADX can only measure the strength of the trend, it does not provide the direction of the trend. For that, you will need the Minus Directional Indicator (-DI) and Plus Directional Indicator (+DI), which makes up the whole ADX system.
Moreover, the ADX uses a more complicated formula and Average True Range (ATR) to “smooth out” the chart, which has a built-in lag. The Aroon Oscillator reacts faster to changing price action compared to the ADX, as there are no smoothing or weighted factors in the formula.
Conclusion
The Aroon indicator is a nifty little tool that you should keep in your day trading arsenal. It is a visual representation of the price action that you can easily interpret to make your decision about the direction and momentum of the price. However, you can dramatically increase the odds of making a profitable trade if you implement a trading strategy around the Aroon indicator by combining it with a breakout strategy or any other price action based strategies.


 Basics of Stock Trading
