Do you notice how a stock or a group of stocks behave when it touches all-time highs? Have you been curious on how stocks perform as they approach this key milestone?
All-time highs in stocks are a phenomenon when the price of the stock touches a new 52-week high.
Surprisingly, or not, there is a lot of hype that surrounds these events. The financial media, both online and offline tend to create a type of hype for such stocks
.
Stocks that are trading at all-time highs evoke an amount of curiosity, enthusiasm and awe from the trading community. But what happens when a stock is trading at an all-time high and how can you capitalize on this information?
As a day trader, a question you might ask is how to use this information to make a profit. Or in some cases, the question is what to do when a stock hits an all-time high.
Should you buy near the highs? Or should you be short selling the rally?
Imagine if you were in a short position, only to see the stock rising to new all-time highs; or in some instances, staying long on the stock only to see it fall in value. Either way, it could turn out to be disastrous.
In this article, we look at how all-time high stocks behave and strategies that you can use to trade. With a bit of logic and some technical analysis, you can trade stocks at all-time highs with some fair amount of success.
The psychology behind all-time high stocks
The all-time highs are just one of the many metrics used to quantify a stock’s performance. But what does it mean when stocks are at all-time highs?
In simple terms, all-time high stocks are stocks that reach a peak value. It is a fresh all-time high, or simply a 52-week high.
These types of stocks are a great example of how psychology is deeply embedded into trading. You can find a lot of research on the subject and there is no dearth of information when it comes to the psychology behind stocks at all-time highs.
For example, this research paper by Justin Birru,“Psychological Barriers, Expectational Errors, and Underreaction to News” shows evidence that, stocks at 52-weeks highs are a psychological barrier.
Surprisingly though, the bias is however in either directions.
Investors either have a downward bias in expectations of a miss on the earnings or some bad news or just the opposite. The upward bias comes on the prospect of a surprise beat on the estimates or other undiscounted news.
It is interesting that in most cases, trading literature talks about fear, as stocks near a 52-week high. This conclusion comes on the premise that the stock would evidently fall after hitting an all-time high. But this is not entirely true.
Let’s read a bit more in detail of how stocks behave near all-time highs.
Most of the times, when a stock hits a 52-week high, investors fear that the price is overvalued. This prevents them from further buying into at the highs. While this may be partly true, investors also need to focus on the fundamentals.
In many cases, stocks near or at 52-week highs come with some amount of overvaluation. This means that the bullish trend might continue, if the fundamentals support the rally.
What happens when stocks hit all-time highs?
As pointed out by the research paper from Justin Birru, stocks can behave differently when reaching a 52-week high. In fact, this article from A Wealth of Common Sense shows a quick statistical analysis.
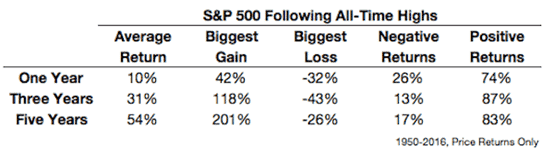
S&P500 – Stock performance following all-time highs
According to the statistics, the average one year positive return is 74% for stocks that break the all-time high. Only 26% of the stocks have a negative return following an all-time high.
When you look at the five year performance, the results are more staggering. But at the same time, the data also shows a contrarian view.
In order for stocks to reach new all-time highs, they are in a drawdown state from the previous peak.
The statistical data might be inconclusive, but a lot depends on the market context. The main question that comes to mind is what makes a stock to continue pushing higher from an all-time high.
Similarly, there is also the question of what makes a stock to retreat from its all-time high.
The above questions can be answered by a research paper from Thomas J. George and Chuan-Yang Hwang, “The 52-Week High and Momentum Investing.”
The main take-away from the research paper gives the explanation as follows:
When good news is published as a stock nears a 52-week high, traders are initially reluctant to bid for higher prices. However, as the news is digested, price tends to continue moving higher.
Conversely, when a stock is nearing the 52-week high, bad news would initially push price lower. But initially traders are not willing to sell, but eventually, let go as the information implies.
What this means is that it can be difficult to predict how stocks will behave when they are trading at all-time highs.
So let’s take a look at some examples.
Examples of stock behavior at all-time highs
There are many factors that attribute to the behaviour of stocks near the all-time highs. For example, in the paper “Industry Information and the 52-Week High Effect” Hong, Jordan and Liu show that there is a strong correlation between the stock and its industry.
For example, look for stocks nearing a 52-week high along with the industry or the sector. This would suggest a higher probability for the stock price to continue the bullish trend.
Most stock market websites show information not just on the individual stocks but also the sector. One of the key things to understand when looking at stocks near all-time highs is for strong fundamentals.
Important announcements about the company also play a role in ramping up investor expectation.
Example of TSLA at all-time highs
The first example below shows Tesla Inc’s price chart. Here you can see that around the quarter ending March, TSLA hit a new all-time high of $280.66.
However, what follows later is the earnings release.
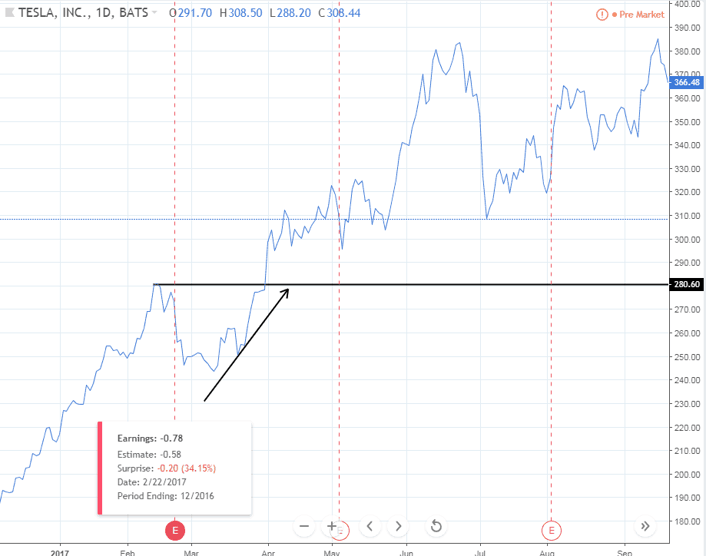
TSLA – Stock price behaviour at all-time highs
At the time, TSLA’s quarterly earnings showed earnings per share at -$0.78. This was more than the Street’s estimate of -$0.58.
The weaker EPS send the stock to decline, falling to lows around $245.00. Later, we see a quick reversal after a few days.
Thereafter, TSLA’s share price breaks past the all-time high into new uncharted territory.
So what was going as price approached new all-time highs?
A quick analysis of the news reports around the time reveals some interesting information. On March 15, Tesla announces raising additional capital over a billion dollars.
The news coincides with the company’s plan to bring its Model 3 which is a higher volume lower cost model to the market for the second half of the year.
Tesla’s SEC filing reflects the company’s intention use to the additional capital towards strengthening its balance sheet. The additional capital was also aimed at scaling the company’s business for the launch of Model 3.
This effectively sent the stock price higher as TSLA’s share price broke past the all-time high of $280.66. Furthermore, news about Tencent Holdings increasing its stake in the company also evokes strong positive sentiment in the stock.
The news effects of the above was enough to push the stock price past the 52-week high.
Example of Abbvie Inc. at all-time highs
Another example below illustrates how bad news can send the stock price lower from all-time highs. The example below is that of Abbvie Inc. After previously rising to highs of $67.39, the stock price starts to sell off.
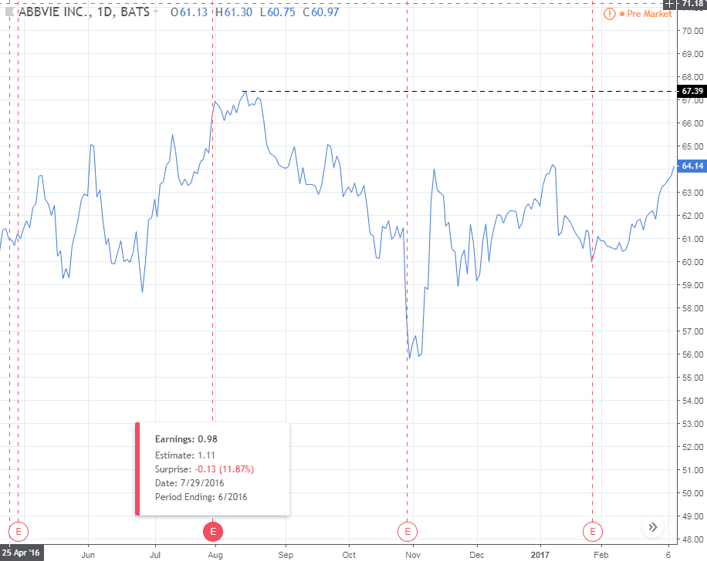
Abbvie Inc. Sell off from all-time highs
The declines came just a few days later; news broke about the company being sued for misrepresentations and omissions.
Abbvie Inc. was embroiled in a legal battle against Elliott Associates on a failed deal with Shire. For nearly the whole next quarter, the stock price for Abbvie Inc. continues to fall.
What’s important to note here is that the all-time high came just after the quarterly earnings report. Abbvie Inc. reported earnings per share of $0.98 which missed estimates of $1.11.
Example of Facebook stock at all-time highs
Another example is the stock chart for Facebook Inc. which makes for an interesting case. On the chart, you can see how price continues to break previous all-time highs.
The bullish trend is strong and the strong fundamentals also support the stock price.
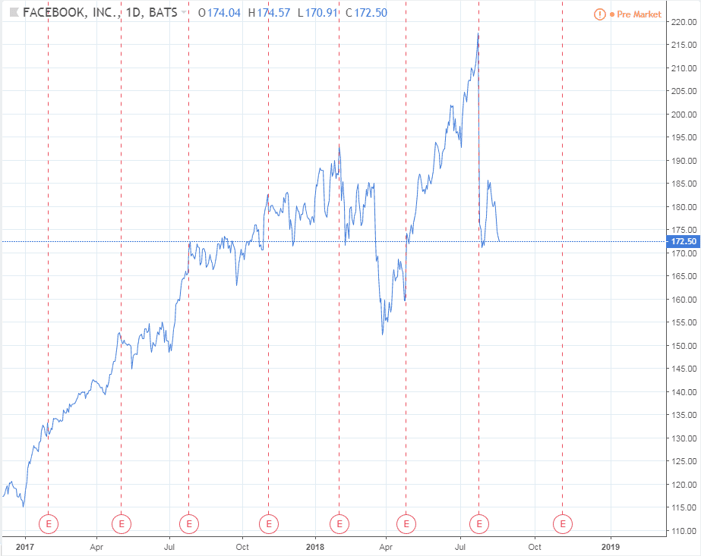
Example of Facebook Inc. Stock chart at new all-time highs
However, towards the very end, you can see price falling sharply. This came despite the most recent earnings report beating the Street’s estimate.
This is contrary to the previous examples because the stock price falls despite strong earnings.
But let’s look a bit deeper.
The company reports falling revenues and gives a bleak outlook for the remainder of the year. All other metrics including operating margins were forecast to be lower, during its earnings call.
Subsequently, the stock price for Facebook extends the declines just after hitting fresh all-time highs.
Strategies for trading all-time highs
If you look close enough at the above example, we can see that the psychological barrier acts as a resistance. Price often tends to pullback from an all-time high (if the declines are valid due to negative news).
Therefore, the first thing to remember is to pay attention to the fundamentals as price approaches a fresh 52-week high and for the first time.
Because all-time highs tend to act as a sort of a technical resistance (due to the psychology involved), traders can easily trade the pull back. Alternately, you can also wait for the decline and go long as price tests a previous all-time high.
Here some ways you can use technical analysis to trade as a stock approaches or sets an all-time high record:
- Candlestick patterns near all-time high levels
- Technical indicators (RSI divergence)
- Support/Resistance levels
- Chart patterns
Look for key reversal patterns such as doji’s or bearish engulfing patterns before you go short.
On the other hand, you can also trade on the long side. To be sure, once a breakout from the previously established all-time high occurs, wait for a pull back before entering the trade. This will give enough time for you to understand the fundamentals which can be a better way to trade after the initial euphoria.
Another way is to look for divergence when the stock is breaking out from all-time highs. Technical oscillators such as the Relative Strength index (RSI) or other similar indicators can help.
The oscillators can depict potential corrections to the trend. This can help with picking the dips to buy into the trend.
Example on how to trade stocks near all-time highs
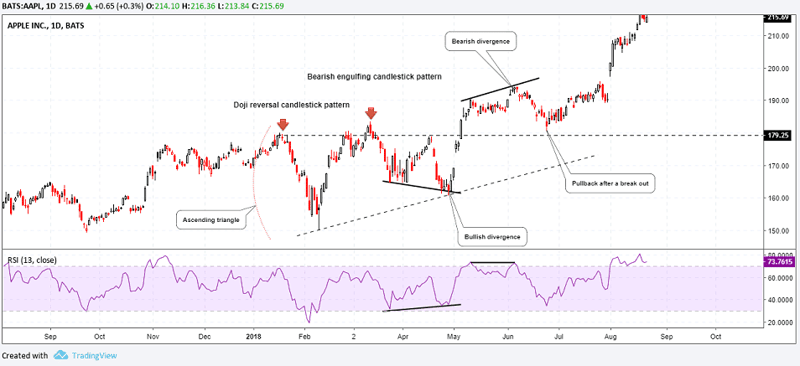
The chart below shows the example of the AAPL stock chart. Here, we can see multiple instances on how you could trade.
The below chart summarizes different ways to analyze and trade AAPL as it set a new all-time high.
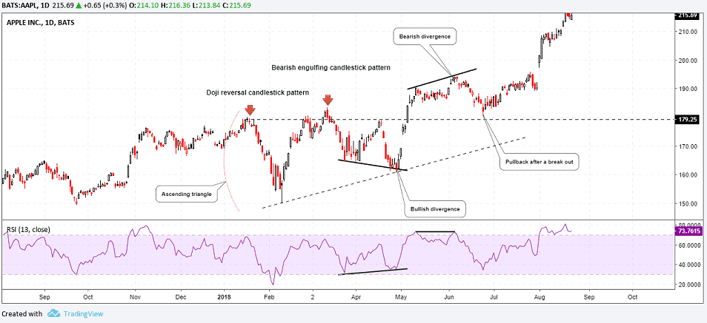
Example of trading APPL at new all-time highs
Candlestick patterns: Following the first doji reversal pattern after the all-time high, you can see that the next attempt to break the all-time high. Here, price action forms a bearish engulfing pattern.
Following this, the stock starts to sell off strongly.
Divergence: The sell off from the stock results in a divergence to the RSI. The bullish divergence then sends the price higher instantly. The same can be seen after price breaks the all-time high.
The bearish divergence following the breakout results in a pull back.
Ascending triangle pattern: The ascending triangle pattern forms over a month. The higher lows and the all-time high resistance level leads to a breakout in the medium term horizon.
The pull back: The pullback after price breaches the all-time high comes with the bearish divergence. But this pullback results in the formation of a higher low above the all-time high.
Following this, price starts to surge strongly.
When looking at how to trade stocks at all-time highs, traders can build their own technical strategies. However, if you keep your chart analysis to the simple and bare minimum, a lot of trading opportunities can come your way.
In conclusion, remember that stocks hitting all-time highs have a breach the psychological barrier. In most cases, when there is bad news, the stock sells off quick quickly after forming an all-time high.
Traders can utilize simply price action based trading strategies or even use technical indicators such as divergence to trade. The most important aspect to remember is of course keeping an ear to the ground as the stock approaches all-time highs.


 Awesome Day Trading Strategies


