What is the Accumulation Distribution Indicator
The accumulation distribution indicator (A/D) provides information regarding the money flow in a stock. The word “accumulation” refers to the level of buying and “distribution” the level of selling.
Therefore, the A/D is a volume-based indicator and is also part of the oscillator family. The indicator fluctuates above and below the zero line.
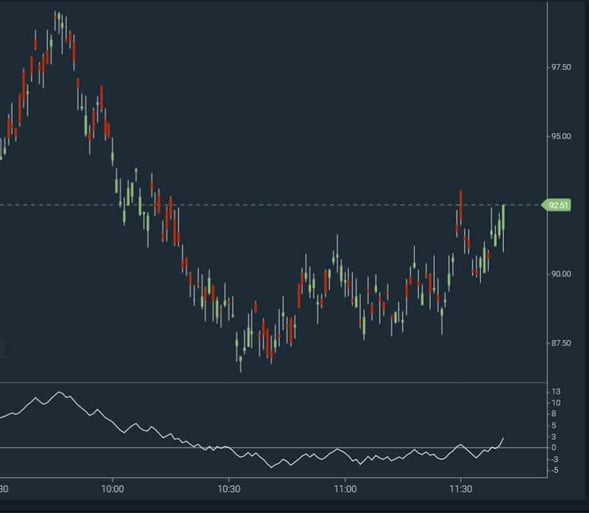
This is an image of an accumulation distribution oscillator.
Accumulation Distribution
Furthermore, notice how the indicator rises above and below the zero line. At first glance, it may appear the indicator just mirrors the price action, but there is much more going on beneath the hood which we will now explain.
Accumulation Distribution Components
The calculation of the accumulation distribution indicator consists of three components- money flow multiplier (MFM), money flow volume (MFV), and accumulation distribution line (ADL).
Money Flow Multiplier (MFM)
MFM = ((Close – Low) – (High – Close)) / (High – Low)
Money Flow Volume (MFV)
MFV = MFM x Volume on the Period
Accumulation Distribution Line (ADL)
ADL = Previous Period ADL + Current MFV
Accumulation Distribution – How to Calculate
Next, we will walk through how to calculate the indicator with the necessary inputs.
Close = $650.00
Low = $648.00
High = $651.00
Volume on Period = 9,500
Previous Period ADL = 180,000
Let’s now add the values to the formulas:
MFM = ((650 – 648) – (651 – 650)) / 3
MFM = 0.3333
MFV = 0.3333 x 9500
MFV = 3,166.35
ADL = 180,000 + 3,166.35
ADL = 183,166.35
Let’s now visualize it:
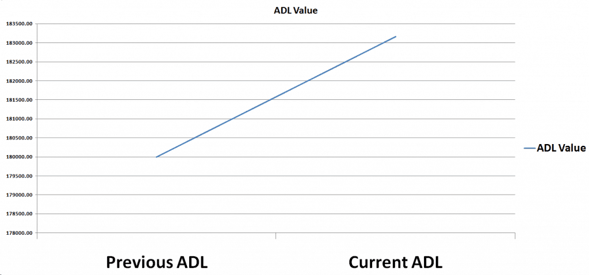
ADL Value
So, in other words, when you apply the parameters used in this example, this is how the ADL prints on the chart. Now see what happens if we add 10 more values to our calculation.
These are the values:
184328
185123
186000
179000
175000
181000
183500
189000
194000
186000
Finally, let’s visualize it!
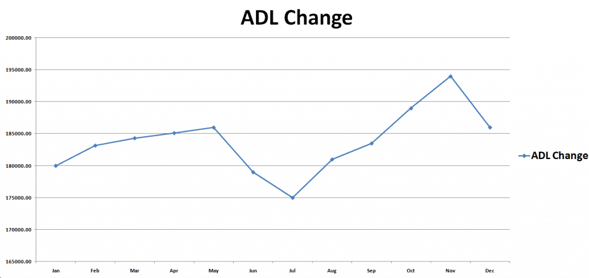
ADL Change
This now looks more like the real thing, right? The point is that the accumulation distribution indicator determines these values based on the high, low, close, and volume of the respective period. Therefore volume and volatility are key inputs.
Four Trading Signals Using the Accumulation Distribution
Now that we have covered the basics of the indicator, let’s dive into four simple trading strategies.
The accumulation distribution indicator line provides two types of signals – trend confirmation and divergence. We will now explore how the indicator can provide signals for both.
1. ADL Trend Confirmation
The trend confirmation signal is very easy-to-understand. It also consists of two types:
a) Bullish ADL Trend Confirmation
The bullish trend confirmation signal comes when the accumulation distribution indicator line increases during times of high volume. This means accumulation is underway, which will likely lead to an increase in the price of the security.
b) Bearish ADL Trend Confirmation
The bearish trend confirmation signal comes when the accumulation distribution indicator line decreases during times of high volume. This signal occurs when price is likely on the decline.
These two signals are crucial for the success of the accumulation distribution indicator oscillator. Traders use them to set entry and exit points on the chart in order to hop into emerging trends and exit at the right moment.
2. ADL Divergence
The ADL divergence is another important feature of the accumulation/distribution indicator. There are two types of ADL divergence based on their potential:
a) Bullish ADL Divergence
To get a bullish ADL divergence we need to identify a couple of things on the chart. The first thing you need is bearish price action. The second is an increasing ADL. These create a strong bullish signal on the chart.
b) Bearish ADL Divergence
To get a bearish ADL divergence we need to identify exactly the opposite setup. We want to identify bullish price action with a decreasing ADL. These create a strong bearish signal on the chart.
3. On Balance Volume and Accumulation Distribution
Before we discuss the trade signals provided by the OBV, let me first explain the differences between the indicators.
Similarly, the OBV pretty much looks the same way as the accumulation distribution indicator, and the signals it gives are interpreted the same way.
However, the two indicators could sometimes diverge. The ADL could move upwards, while the OBV could move downwards.
So, why would the two indicators diverge if they are both volume-based?
The answer to this question is due to the differences in the formulas of these indicators. The ADL compares the current close with the current high and current low. The OBV compares the current close with the previous close.
But, the real question is what direction will the stock go after the divergence emerges?
First, see if the stock is trending. Next, validate the trend is high if there is high volume to support the move.
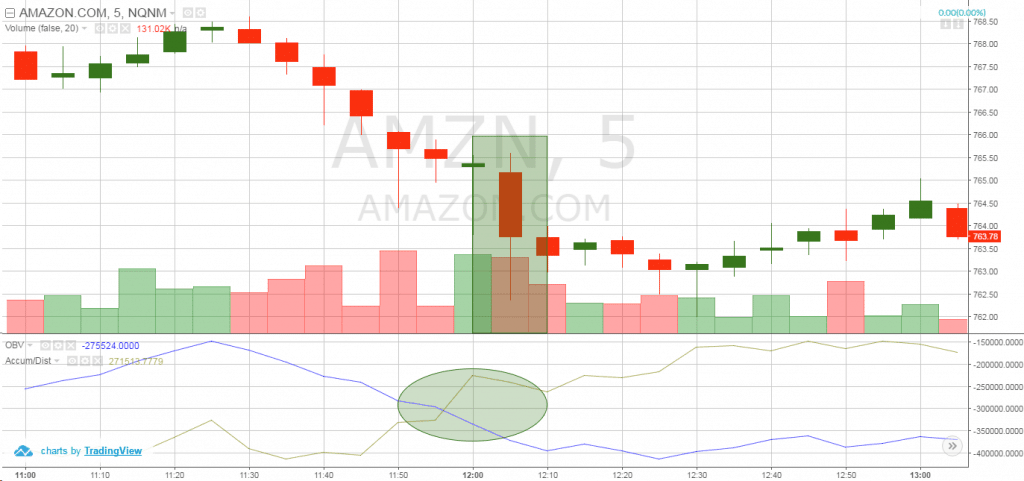
Here we have a classic divergence between the OBV and ADL. The two lines cross creating a divergence. Fortunately, the trend is bearish and is confirmed with relatively high trading volumes. Therefore, we get a bearish signal on the chart.
a) Accumulation Distribution Trading System with the OBV
Let’s now discuss the trading rules involved when trading with the ADL and on balance volume:
ADL & OBV Trade Entry
Enter a trade when you get a matching signal between the two indicators, accompanied by higher trading volumes.
When this happens you enter the trade in the direction of the trend.
Make sure you always protect your trades with a stop-loss order.
To determine the right place for your S/L order, you should use standard price action rules.
If you are entering a long trade, you should find support prior to the trade signal. Then you place your stop loss underneath. If you are going short, you do the exact opposite; find a resistance level established prior to the signal and place your stop order above this level.
Profit Targets using the ADL and OBV
If the ADL and the OBV are increasing on high volumes, you should hold your long trade.
Conversely, if the ADL and the OBV are decreasing you should stay short. However, once the indicators shift in the opposite direction, it’s now time to take your profits and exit the trade.
Accumulation Distribution Strategy Example
Now let’s approach a strategy that will combine these rules into a complete trading system.
Accumulation Distribution Trading Strategy
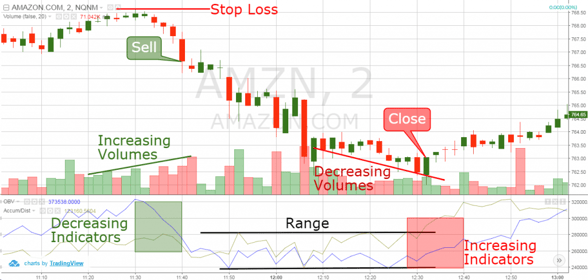
For example, we have the 2-minute chart of Amazon from August.
First of all, the chart starts with a range from the leftmost side. The ADL and the OBV indicators are concentrated in the upper area. Suddenly, the price begins to decrease.
At the same time, the two indicators decrease as well while volumes are increasing. The decrease in the indicators gives you a short signal on the chart. The increasing volumes are used to confirm the validity of the signal.
Time to Short Amazon
Therefore, we short AMZN.
The stop loss for this trade should be placed above the last resistance prior to the price decrease. This stop-loss area is highlighted with the red horizontal line on the chart.
After we sell AMZN, the price begins to decrease. The drop is so strong that the stock even gaps down 4 periods after we enter the market.
In fact, in the middle of the bearish trend, the two indicators enter a range phase. We outline the levels of the range with the two black lines in the area where the indicators are plotted.
At the same time, the volumes are decreasing as well. Then the two indicators start increasing and the stock accumulation distribution indicator line breaks the upper level of the range. At the same moment, the price action creates a bigger bullish candle. We can use this candle to exit our short trade. See that the price switches directions afterward.
Let’s now review a trading example of a divergence between the ADL and OBV indicators:
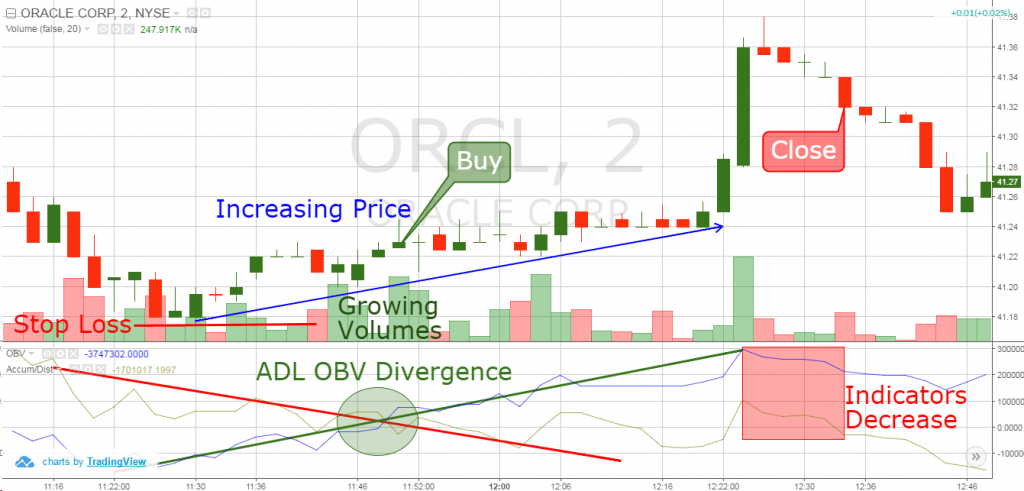
Above you see the 2-minute chart of Oracle.
As a result of the drop, the price attempts to enter a bullish trend. The two indicators have been moving toward each other until they cross.
The interaction (green circle) is represented by the red and the green lines in the indicator area. At the same time, the trading volumes have been increasing.
Since the price is attempting to enter a bullish trend, we trade in this direction. We open a long trade right after the crossover of the two indicators.
Stop on the Trade
Thus, the stop of this trade should be placed below the bottom created at the beginning of the trend reversal. Therefore, the location of the stop is shown with the red horizontal line.
The price increase continues afterward with increasing volumes.
Suddenly, Oracle explodes in a bullish direction. The increase is rapid and is contained by only two candles. At the same time, the two indicators also increase and reach relatively high values. Then the ADL and the OBV start dropping, which is shown in the red square.
While the indicators are beginning to fall, the volume also has a dramatic drop. This is the signal we were waiting on for confirmation to exit our trade.
Conclusion
- The accumulation distribution indicator is a volume-based oscillator.
- It consists of a single line, which fluctuates above and below a zero level.
- The accumulation distribution calculation consists of three formulas:
- MFM = ((Close – Low) – (High – Close)) / (High – Low)
- MFV = MFM x Volume on the Period
- ADL = Previous Period ADL + Current MFV
- The 4 tips on how to use the Accumulation Distribution Indicator to trade signals are:
- Bullish Trend Confirmation
- Bearish Trend Confirmation
- Bullish Divergence
- Bearish Divergence
Trading Rules
- The three important rules to trade with the ADL and the OBV are:
- Open a trade when you find matching signals. Open a trade in the direction of the trend if the two indicators contradict (diverge, cross) during high or increasing volumes.
- Place a stop above/beyond a support/resistance level created prior to the signal.
- Stay in the trade as long as the two indicators are supporting your trading decision.
Lastly, to learn more about how to use the accumulation distribution indicator, check out this video on YouTube. The video goes into great detail about how to interpret signals from the indicator.


 Volume Indicators


